Download
1 / 5

E N D
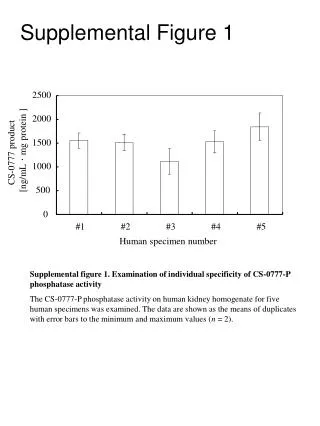
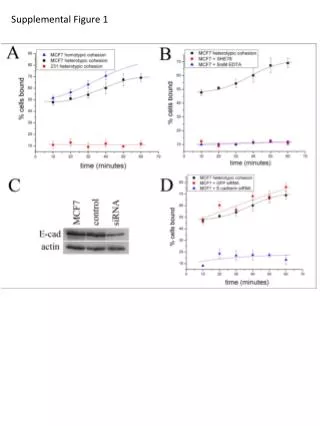
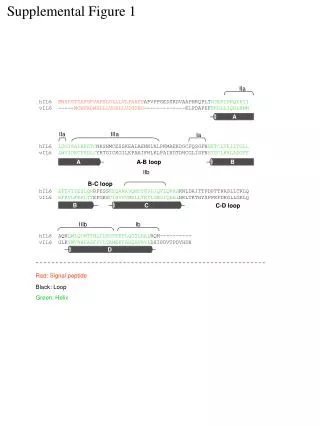
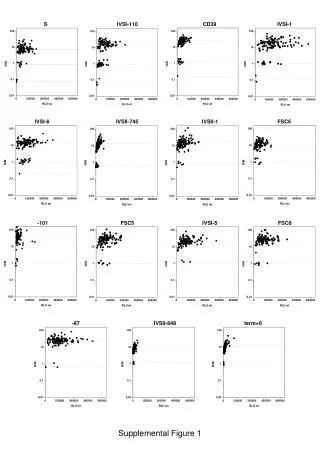
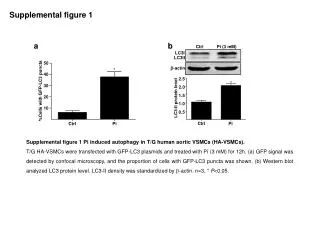
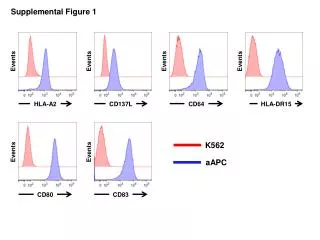
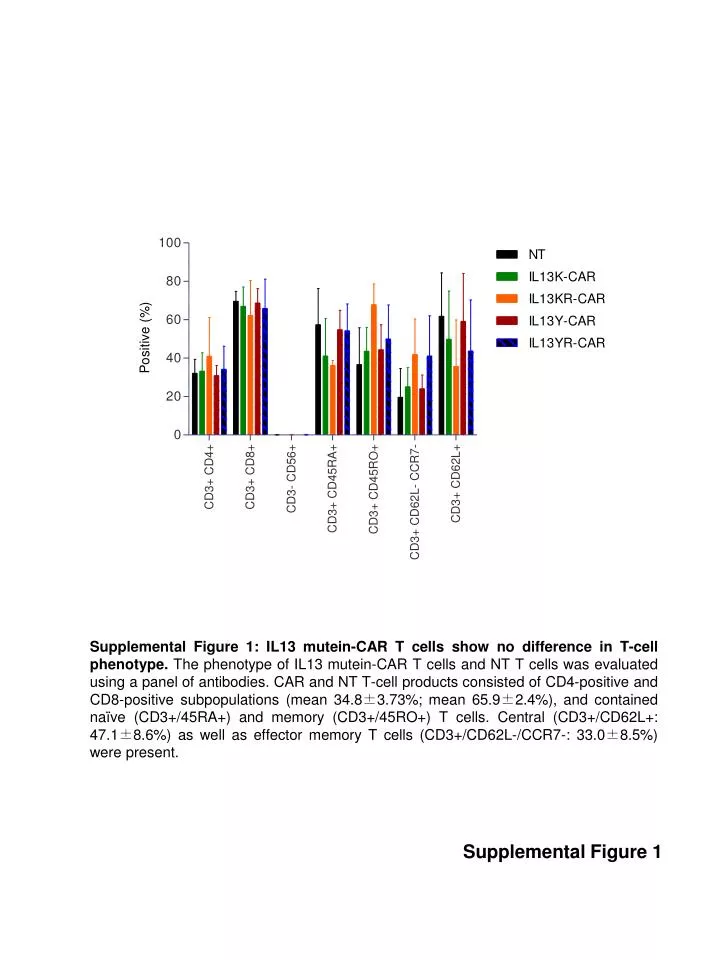
Supplemental Figure 1: IL13 mutein-CAR T cells show no difference in T-cell phenotype. The phenotype of IL13 mutein-CAR T cells and NT T cells was evaluated using a panel of antibodies. CAR and NT T-cell products consisted of CD4-positive and CD8-positive subpopulations (mean 34.8±3.73%; mean 65.9±2.4%), and contained naïve (CD3+/45RA+) and memory (CD3+/45RO+) T cells. Central (CD3+/CD62L+: 47.1±8.6%) as well aseffector memory T cells (CD3+/CD62L-/CCR7-: 33.0±8.5%) were present. Supplemental Figure 1
(A) IL13Rα1 (mg/mL) (B) IL13Rα2 (mg/mL) • Supplemental Figure 2: IL13 mutein-CAR T cells secret IFNγ in an antigen-dependent manner. IL13K-CAR, IL13Y-CAR or non-transduced (NT) T cells were stimulated with increasing amounts of recombinant IL13Rα1 (A) or IL13Rα2 (B) proteins. After 24h IFNγ was measured by ELISA (n=2, assay performed in duplicate for each donor; mean and SD is shown); ≥250mg of IL13Rα1 and ≥ 125mg of IL13Rα2 protein induced significant IFNγproduction (p<0.05) of IL13K-CAR or IL13Y-CAR T cells in comparison to unstimulated T cells. Supplemental Figure 2
K NT Y YR KR Donor 3 Donor 2 Donor 1 U373 U373 U373 IL13Ra1+/a2+ A431 Raji A431 Raji T cells 293T Lysis (%) IL13Ra1+/a2- IL13Ra1-/a2- Supplemental Figure 3: IL13 mutein-CAR T cells kill IL13Ra1+ and IL13Ra2+ cells. All four IL13mutein-CAR constructs (K, KR, Y, YR) killed IL13Ra1+/a2+ cells (U373), IL13Ra1+/a2- cells (A431 or 293T). In contrast IL13Ra1-/a2- cells (Raji or T cells) were not killed. Non-transduced (NT) T cells had no cytolytic activity. E:T ratio Supplemental Figure 3
A B GL261 B16F10 Murine T cells Lysis (%) E:T ratio • Supplemental Figure 4:IL13 mutein-CAR T cells recognize and kill murine IL13Ra1- and IL13Ra2-positive cells. (A) qRT-PCR analysis of murineglioma (GL261),melanoma (B16F10), and murine T cells. (B) Human IL13-mutein CAR T cells (IL13K, IL13KR) killed IL13Ra1-positive (GL261) andIL13Ra2-positive (B16F10) cells. In contrast murine IL13Ra1- and IL13Ra2-negative cells (T cells) were not killed. NT T cells had no cytolytic activity. Supplemental Figure 4
A 50.6% GFP CAR B C • Supplemental Figure 5: Limited persistence of 2nd generation IL13 mutein-CAR T cells in vivo.IL13KR-CAR T cells were transduced to express eGFP.ffLuc. (A) FACS analysis confirmed the expression of CAR and eGFP.ffLuctransgenes.(B) IL13KR-CAR and IL13KR.eGFP.ffLuc T cells killed IL13Ra1+/IL13Ra2+ cells (U373) in contrast to IL13Ra1-/IL13Ra2- cells (Raji cells) in a standard 4hchromium release assay. (C) 1 x 10⁵ unmodified U373 cells were injected intracranially into mice. On day 7 mice received 2 x 10⁶ IL13KR.eGFP.ffLucCAR T cells intracraniallyusing the same tumor coordinates. Bioluminescence imaging was used to monitor T-cell persistence. Supplemental Figure 5