Download
1 / 24
240 likes | 251 Views
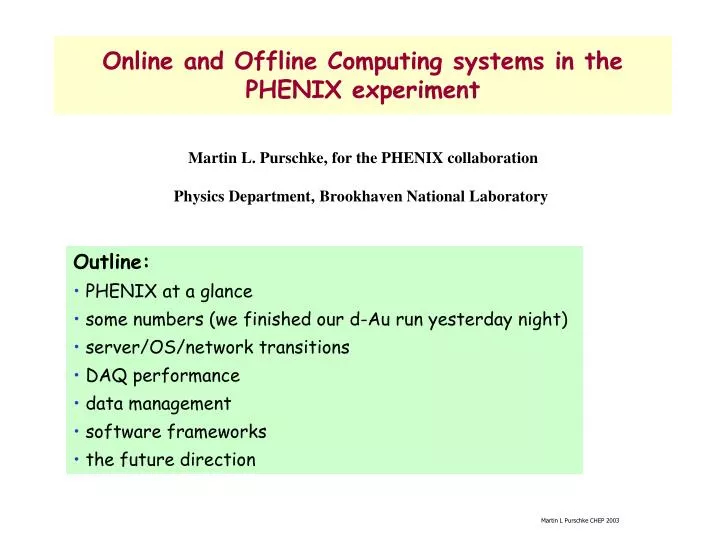
Online and Offline Computing systems in the PHENIX experiment. Martin L. Purschke, for the PHENIX collaboration Physics Department, Brookhaven National Laboratory . Outline: PHENIX at a glance some numbers (we finished our d-Au run yesterday night) server/OS/network transitions

E N D
Online and Offline Computing systems in the PHENIX experiment Martin L. Purschke, for the PHENIX collaboration Physics Department, Brookhaven National Laboratory • Outline: • PHENIX at a glance • some numbers (we finished our d-Au run yesterday night) • server/OS/network transitions • DAQ performance • data management • software frameworks • the future direction
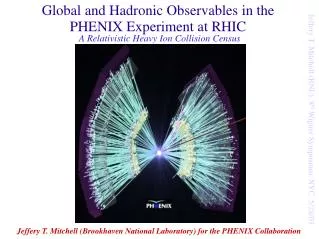
PHENIX PHENIX is one of the big experiments at RHIC.
PHENIX in numbers 4 spectrometer arms 12 Detector subsystems 350,000 detector channels Lots of readout electronics Event size typically 90Kb Data rate 1.2 - 1.6KHz, 2KHz observed 100-130MB/s typical data rate expected duty cycle ~50% -> 4TB/day We saw (as of Thursday noon) almost exactly 40TB of beam data (not counting calibrations etc) We store the data in STK Tape Silos with HPSS Finished the RHIC d-Au run yesterday around 8pm EST Have ~5 weeks of beam studies for pp running then 3 weeks of polarized protons.
Run ‘03 highlights • Replaced essentially all previous Solaris DAQ machines with Linux PC’s • Maturity of Orbix/Iona made that possible • Went to Gigabit for all the core DAQ machines • tripled the CPU power in the countinghouse to perform online calibrations and analysis • Quadrupled our data logging bandwidth throughout • boosted our connectivity to the HPSS storage system to 2x1000MBit/s (190MB/s observed)
ATP SEB ATP SEB ATP SEB SEB ATP ATP SEB ATP SEB ATP SEB SEB ATP ATP SEB SEB ATP Data flow Event Builder ATM Crossbar Switch Buffer Box To HPSS Buffer Box Buffer boxes 2TB disk each buffers approx. 6hrs worth of data before they are shipped off to HPSS SubEvent Buffers (26) (see parts of the event) Assembly & Trigger Processors (~ 23) (see whole events)
ATP SEB SEB ATP ATP SEB ATP SEB ATP SEB ATP SEB SEB ATP ATP SEB ATP SEB SEB ATP Event Builder Event Builder ATM Crossbar Switch 1 Event (parts distributed over all SEB’s) 1 Event (all parts sent to one ATP)
ATP ATP ATP Buffer Box Disk Arrays To HPSS ATP ATP ATP Buffer Box Disk Arrays ATP ATP ATP ATP Data transfer Most of the transfer workload is carried by the buffer boxes. Each has 2 1TB SCSI disk arrays, and dual GigaBit NICs FORE Switch
The Buffer Boxes Back in 2000, we started out with a SUN Enterprise System -- and got 8MB/s despite our best efforts. We had what the experts had previously recommended, only to learn that another $45K in hardware and licenses would finally get us what we wanted - perhaps. Also, with SUN/SGI/IBM/… there is a byte-swapping issue between the buffer box and the Intel-based Event Builder In 2001, we went with $5K Linux PC’s, and never looked back In Fall 2002 we upgraded to the then-latest dual 2.4GHz E7500 power machines (SuperMicro) Each one has 12 160G Seagate disks, 2 1TB file systems, ext3, Software Raid 0 striped across 12 disks, 2 SCSI controllers iozone gives disk write speeds of 150-170MB/s for file sizes in our ballpark. Network throughput is about 85MB/s in from the ATPs (regular network) and 100 MB/s out to HPSS (different network, Jumbo frames)
Throughput stripcharts This measures the data flow in MB/s through the NIC’s of each buffer box. Red is the flow from the DAQ. This is (towards the end of a RHIC store) a modest rate, 2x35 MB/s. Mostly driven by the trigger rate. 50 Minutes 1st buffer box 40MB/s MB/s 2nd buffer box We can do better... Time -->
We see about 75 + 105MB/s throughput The connection is not entirely symmetric; one is through one addt’l switch - that’s the difference. We ended the run, and started the transfer to HPSS A few minutes later... This is the end of the store shown before. At the end, RHIC lost control of the beam and sprayed our detectors, causing a surge in triggers...
A little detour: E.T. In 1999 or so, the ET software was re-engineered and improved at Jefferson Lab (Carl Timmer et al) from the “DD” software previously developed by us, nice technology transfer project. It’s the workhorse system for accessing data online in real-time. Allows a virtually unlimited number of clients to retrieve data according to an event profile (like the label on a FedEx envelope). Is network-transparent Data can be “piped” from pool to pool, so subsystem processes can locally funnel events to multiple processes. Supports all data access modes you can think of and then some - profile-select, load balancing shared, non-exclusive shared, ratio, guaranteed delivery, etc, etc. Very versatile.
ATP ATP ATP ATP ATP ATP ATP ATP ATP ATP Data Flow (old) Until recently, we transferred the data through an “ET” pool on the buffer boxes, which was our way to merge the data streams from the ATP’s. The logger would read the data from the pool, and write them to disk A separate secondary monitoring pool is fed from the primary with about 20% of the data for online monitoring purposes Disk Array Logger Master ET Pool Monitoring ET Pool Buffer Box Dedicated machine Event receivers E.T. has served us well, but with 4x the speed it couldn’t keep up. It’s still used for the online monitoring now.
Buffers, not Events We don’t transfer single-event data chunks but buffers of events, strictly for network performance reasons -- larger transfers, more speed. Master ET Pool Disk Array Logger ATP Buffer Box Event receiver At the back end, we again write buffers, for data integrity we write those buffers in multiples of 8KB -- if something is corrupt, you skip 8K blocks until you find the next buffer header. But it’s a lot of overhead -- buffers get disassembled into events, fed to the pool, re-assembled into buffers...
ATP ATP ATP ATP ATP ATP ATP ATP ATP ATP The new stuff... …called Advanced Multithreaded Logger (AML). Advances in multi-threading in Linux allowed us to make a logger which receives data from a number of network sockets (ATP’s), one thread per ATP handles the connection. Writing to the output file can be easily regulated by semaphores (hence threads, not processes). But the real gain is that the buffers sent from the ATP’s are written to the file as they are. No disassembly/assembly step. Less overhead. Much easier. AML Disk Array Fewer moving parts, more speed. And it opens up new possibilities... Threads
buffer buffer buffer buffer buffer buffer Gzip algorithm Add new buffer hdr New buffer with the compressed one as payload Gunzip algorithm Original uncompressed buffer restored We have a PHENIX standard of compressed data … not just zero-suppressed, actually compressed. We write the data in buffers. In the I/O layer: This is what a file normally looks like This is what a file then looks like On readback: All this is handled completely in the I/O layer, the higher-level routines just receive a buffer as before.
…but pretty expensive Compressed PRDF’s are expensive to get. We have used them so far for “slow” data such as calibrations. It’s too computing-intensive to do on the buffer boxes. With the AML where we just move ready-made buffers, the ATP’s could send already compressed buffers. We could distribute the load over many CPU’s. It’s compelling: /data> time dpipe -s f -d f -z /common/b0/eventdata/EVENTDATAxxx_P01-0000077374-0000.PRDFF xx.prdfz 112.130u 12.290s 2:21.86 87.7% 0+0k 0+0io 301pf+0w ls -l /common/b0/eventdata/EVENTDATAxxx_P01-0000077374-0000.PRDFF xx.prdfz 1574395904 Mar 10 01:29 /common/b0/eventdata/EVENTDATAxxx_P01-0000077374-0000.PRDFF 699604992 Mar 10 23:37 xx.prdfz 699604992/1574395904 = 44% We could shrink the output size to below 50%
Monitoring/Analysis software We have a long and successful tradition of using just one analysis software package in online and offline. One learning curve, one set of libraries. In offline/batch, the online capabilities are just not used (but the package has all the online power still under the hood). We make use of the multi-threading capabilities of ROOT to look at Histograms/data while data are being processed by a background thread. Required for online monitoring. That framework, called “pMonitor”, is used for all online monitoring tasks. It can read all kinds of data streams (file, ET, …), it’s all transparent to the user. Other packages (reconstruction, online calibrations, monitoring…) build on that basic framework. We are about to release a new reconstruction framework (work-name “fun4all”) that supports plugin-style analysis modules. This has already been used in the online analysis in this run. Overall, we have had good success with this “one package fits all” approach.
Open Source, please • We had a somewhat troubled relationship with proprietary software. Your interests are virtually never in the vendor’s economic interests, and you are left behind. • At this point, we use 3 commercial packages (not counting Solaris compilers, and VxWorks stuff etc) • Objectivity • Orbix/Iona • Insure++ Orbix is used exclusively in the DAQ. Not a problem. Objectivity is different. We have a concurrent license deal with Objy so collaborators have access to the software. Still, it is on its way to become a liability. Holds us back at gcc-2.95-3, other packages start to want gcc 3.2. We used Insure++ to hunt down memory leaks in the past. The freebie Valgrind package does a much better job. Finds leaks and uninitialized var’s that Insure didn’t. And faster (a full Insure rebuild used to take days).
Data management With multiple-TB data sets, we had to address the data management. The days when you could have a list of golden runs in your logbook are over. Early on, we restricted the database to management of meta-data (flat files + database info). Worked so far, but: We need to distribute files automatically across file servers to balance the server load Need to avoid needless replication of files and resolve ownership issues (when can a file be deleted? When copied?), also desired replication for popular files We always had a “Data Carousel” interface to HPSS that would pool requests and gave us a performance boost of about a factor 7 over a first-come, first-serve model New additions are ARGO (a Postgres-based file catalog) that keeps track of where resources are located, name-based position-independent identification of files, etc Also FROG (File Replica On a Grid) that is integrated into pmonitor, API and Web interfaces to ARGO. Don’t miss Irina Sourikova’s talk tomorrow, Cat. 8, 2:30.
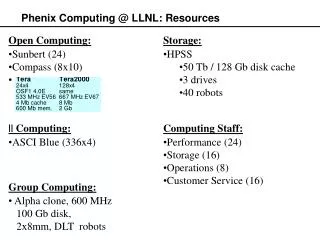
PHENIX Computing Resources • Locally in the countinghouse: • ~110 Linux machines of different ages ( 26 dual 2.4GHz , lots of 900-1600MHz machines), loosely based on RedHat 7.3 • configuration == reinstallation, very low maintenance • 8TB local disk space • At the RHIC computing facility: • 40TB disk (PHENIX’s share) • 4 tape silos w/ 420 TB each (no danger of running out of space here) • ~320 fast dual CPU Linux machines (PHENIX’s share)
Online computing tasks With the data still present in the Countinghouse, we try to get as much as possible done while the getting is good (access later is much more expensive) About the last time that all files belonging to a “run” are together in one place We try to filter and analyze interesting events (calibrations, special triggers, etc) for monitoring purposes and calibrations The (somewhat ambitious) goal is to have as much of the preparations done as possible so that reconstruction can begin by the time the data leave the countinghouse. Still work in progress, but we’re optimistic.
0Invariant Mass Spectrum PHENIX ONLINE Electron-Positron Invariant Mass Spectrum Dimuon Invariant Mass Spectrum 8 J/ J/ PHENIX ONLINE PHENIX ONLINE Near-Online results
Upgrade plans • Locally in the countinghouse: • go to Gigabit (almost) everywhere (replace ATM) • use compression • replace older machines, re-claim floor space, get another factor of 2 CPU and disks • get el cheapo commodity disk space (“545” project, meaning 5TB for 5K$), say, another 10TB or so • In general: • Move to gcc 3.2, loosely some Redhat 8.x flavor • fully deploy ARGO, FROG • we have already augmented Objectivity with convenience databases (Postgres, MySQL), which will play a larger role in the future. • Network restructuring: Go to Jumbo frame network for DAQ?
The End. Thank you. A picture from the PHENIX Webcam

![PHENIX Computing Center in Japan [CCJ]](https://cdn1.slideserve.com/3268026/phenix-computing-center-in-japan-ccj-dt.jpg)