Download
1 / 24

E N D
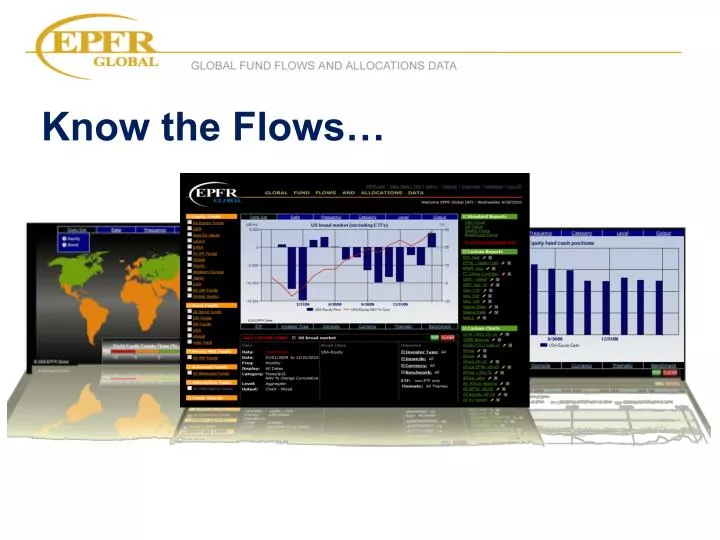
Company Overview EPFR Global delivers a complete and transparent picture of institutional and individual investor flows driving global markets. Strategists, traders, and investors use EPFR flow and allocation data to gain the most current, global view of changing investor demand and manager positioning. Trading and allocation strategies leverage EPFR historical and current data to improve returns and manage risk. • Series sourced through direct relationshipswith fund managers and administrators • The universe covers over $17 trillionin globally domiciled funds. • EPFR flows are available at either the asset class aggregate, fund group, investment manager, individual fund and share class levels to support the most granular and informed insights. • Comprehensive, transparent, and robustdaily, weekly, monthlyupdates available T+1 in addition to historical time series.
Users of EPFR Data Banking and Brokerage Government/Central Banks • Strategists • Capital Markets • Research Analysts Types of usage: • Proprietary trading • Directional calls for clients • Targeting sales efforts • Market analysis • Regulators • Monetary Authorities Types of usage: • Cross-border flow analysis • Flows impact on currency as well as local equity/debt markets Asset Managers Hedge Funds • Fund Managers • Portfolio Analysts • Marketing and Product Development Types of usage: • Factor in investment process • Competitive analysis, product dev • Asset allocation • Quantitative analysis • Global Macro/EM/Discretionary • Quantitative Investors Types of usage: • Momentum trading • Liquidity analysis • Market timing
EPFR Global Key Data Sets Derived Datasets(based on flows and allocations data) Core Datasets(based on data sourced directly from managers or administrators) Fund Flows Fund Allocations Country & Sector Flows The amount of cash flowing into and out of funds world-wide. Fund manager allocations at month-end across the countries or sectors they invest in. + Distribution of fund flows by country or sector. Combines data from fund flows and fund allocations. = • Country Weightings – Monthly • Sector / Industry Weightings – Monthly • Equity / Bond Fund Holdings – Monthly • Country/Sector/Industry FlowsDaily/Weekly/Monthly • Regional packages available Daily/Weekly/Monthly • Equity/Bond Fund Flows Daily/Weekly/Monthly * also includes AUM, Performance
Fund Flows Overview Leverage the transparency of the EPFR universe and the granular breakdown of flows Fund Flows Fund Flows The amount of cash flowing into and out of funds world-wide. The amount of cash flowing into and out of funds world-wide. • What are Fund Flows? • Calculates “Net Flows” (investor contributions/redemptions) for individual funds and then add these up by asset class • Net Flow calculations exclude portfolio performance and currency fluctuations • Includes funds registered globally not just those domiciled in the US • Updated daily/weekly/monthly
Fund Flows: Asset class breakdown Highly granulated flow data for more than 100 country, regional, sector and asset class categories (includes Global & US )
Fund Flows: Drill down to detail view ……………………………………………………………………………..………………………………………………….………….…… 7
Fund Flows: Investor types differentiation US equity fund flows since January‘10 US Institutional Investors All investor types US Retail investors Non-US investors in US equity • Only US institutional investors were the main buyers ‘at the bottom’ • US Retail investors missed the big US Equity rally between Q2/2010 and Q1/2011. • Non-US investors (US equity funds domiciled ex US) stayed away in Q2/Q3 2010
Fund Flows: The Big Picture Total Aggregate Equity, Fixed Income, and Money Market Fund Flows Recent flows are still largely in favor of Fixed Income funds, although the overall flight from equities has temporarily reversed course Global cross-asset allocation Developed vs. Emerging Market Equity Flows Until the recent rally, investors have shown a lack of confidence in equity markets, as flows continue to remain in the red over the past year Developed vs. Emerging Market Fixed Income Flows Demand for Emerging vs. Developed Market debt has skyrocketed this year as investors search for favorable yields
Fund Flows: Practitioner examples and investment signals Global cross-asset allocation
Practitioner Example: Global risk indicator Best call: On May 6th 2010 – BofA backtesting indicates that GFSI would have flashed "sell.” Risk assets sold off over the next 30 days, as equities corrected 5.5%, commodities fell 8.1% and HY bonds lost 2.6% Chart 4 shows a backtested chart of the GFSI sell indicator and the performance of major asset classes. The GFSI would have warned of a major correction in risk assets on 6th May 2010. Source: BofA Merrill Lynch Global Research, EPFR Global, Bloomberg; indexed to 100 in Oct’09
Practitioner Example: Global cross-asset allocation Chart 10: End-of-month ‘best-of-two’ strategy for global equities vs global bonds based on the four-week average fund flows as a percentage of AuM into risk assets and money market funds Chart 10 shows that the results of the monthly ‘best-of-two’ strategy for global equities and global bonds are similarly convincing. The strategy would have generated an excess return of roughly 8pp per year before costs, and total return was more than twice the benchmark return with lower volatility. The strategy therefore clearly dominates the equally-weighted benchmark. Using money market returns as risk-free rate, the strategy has had a Sharpe ratio of 1.3 since 2004, while the benchmark only had a Sharpe ratio of 0.2. On average, funds would have to be switched between global equities and global bonds three times per year; so even including transaction costs, a significant excess return would have been earned. These results clearly suggest that the direction of flows into or out of risk assets and into or out of money market funds contains information about future performance of equities versus bonds. Source: EPFR, Datastream, Commerzbank Corporates & Markets
Practitioner Example: Credit research analysis US Credit Outlook Support from the deep The ‘hidden force’ supporting asset prices is, of course, the flood of liquidity from the Fed. In his most recent testimony and elsewhere, Bernanke has deemed the fact that “equity prices have risen significantly, volatility in the equity market has fallen, [and] corporate bond spreads have narrowed” as evidence “that the Federal Reserve’s recent actions have been effective.” By holding interest rates on cash at zero even as the economy has continued to recover, the Fed has left investors scrambling for return wherever they can find it. Much of the rally has been justified by the recovery in the economy, of course. Yet the fall in yields to their lowest levels since the 1960s, the simultaneous rally in gold and recent sell-off in the dollar, leave us thinking that this is about more than just fundamentals. In some ways the fund flows speak louder than the actual market movements: investors have been selling cash assets to buy almost anything else. In 2010, much of this liquidity was making its way into EM; now that investors are growing nervous about political stability, it has again been channeled into US and developed markets (Figure 5). Even IG at 3% starts to look interesting when cash deposits and money market funds are yielding virtually nothing. Source: Citi Investment Research and Analysis, EPFR
Country & Sector Allocations Overview Fund Allocations Fund manager allocations at month-end across the countries or sectors they invest in. • What are Fund Allocations? • Monthly data reported by managers or administrators (based on holdings, fund factsheets) • Fund level detail includes total fund assets, % weight in cash, % weight by country • Includes funds registered globally not just US
Country Allocations: Overview Actual country and regional weightings (in % of AUM) 15
Country Allocations: Relative Country Weights Non-ETF Global Equity Fund Active Weights vs. MSCI ACWI ETF Americas Europe & Middle East Pacific Asia EMEA Latin America
Country & Sector Flows Overview Fund Allocations Country or Sector Flows Fund manager allocations at month-end across the countries or sectors they invest in. Distribution of fund flows by country or sector. Combines data from fund flows and fund allocations • What are Country Flows/Sector Flows ? • EPFR multiplies the most recently available Fund group allocations (to a country or sector) x Flows into that Fund Group - to estimate overall flows at a country or sector level. • Allows users to analyze flows by fund group, ETF vs MF, and by domicile • Includes funds registered globally not just those domiciled in the US • EPFR also tracks flows to dedicated Sector Funds, as an alternative measure of demand for individual sectors
Cumulative 52 Week Flows Weekly Flows(% AuM) Practitioner Examples: Sector Flows Consumer Discretionary Consumer Stapes Cumulative Sector Flows are still in the red for the most part, with the Materials sector being the only exception Energy Financials Healthcare Industrials Materials IT Utilities Telecom
Practitioner Examples: Global Country Allocation Model • Backtests using EPFR Fund Allocations and Fund Flows as factors in a global country selection model yield convincing results • Investment factors • Active Country Flow compares one country to the cross sectional average • Active Investor Spread uses EPFR country allocations data to measure active, speculative investor activity in emerging markets • Model Features • Provides an interactive environment for portfolio managers to backtest strategies with EPFR Fund Flow & Allocations data • Create custom country portfolios • Adjustable factor weightings and strategy parameters allow for a high level of adaptability Utilizing Flows in Multi-Factor Asset AllocationGlobal Country Selection Model In this report, we demonstrate how utilizing EPFR Country Flows alongside standard investment factors add value to country allocation strategies
Sample Clients "The flow data from EPFR has proved to be a useful source of added value in some quantitative models of equity markets we have constructed. It provides an extra dimension of information to that available from the typical equity market databases used by quants and so affords an edge in performance over much of the competition." Dr. Stephen Rees Head of Investment Process Research Schroders, London Sell Side Buy Side Government/Media “Emerging market mutual funds' country allocations appear to contain information on future equity returns beyond that contained in standard valuation and momentum indicators.” Analyst Global Asset Allocation Research Team Salomon Smith Barney “I find the EPFR Global Country Weightings Report to be an invaluable tool in helping me track my competitors' regional and country allocations on a monthly basis. The Report is timely and very comprehensive.“ Brad Aham Portfolio Manager State Street Global Advisors