Download
1 / 19
190 likes | 280 Views
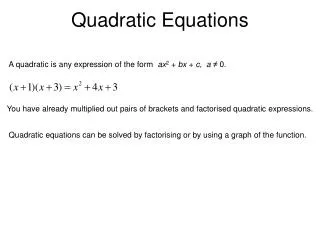
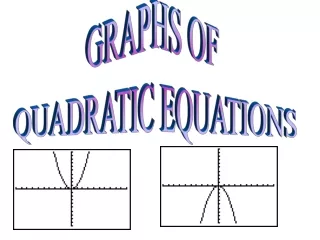
9.3. Graphs of Quadratic Equations. Standard Form: y = ax 2 +bx+ c. Shape: Parabola. Vertex: high or low point. Axis of Symmetry:. Line that divides parabola into two parts that are mirror image of each other. Axis of Symmetry. Vertex. The vertex has an x-coordinate of.

E N D
9.3 Graphs of Quadratic Equations
Standard Form: y = ax2+bx+ c Shape: Parabola Vertex: high or low point
Axis of Symmetry: Line that divides parabola into two parts that are mirror image of each other. Axis of Symmetry Vertex
The vertex has an x-coordinate of The axis of symmetry is the vertical line passing through
y = x2 First find the vertex. 0 is the axis of symmetry: This is the x value of the vertex, now find the y value. If x = 0, y = 0 Vertex = (0,0)
Example: y = x2 Make a table fory = x2 Since the vertex is (0,0), pick an x value to the right and left of 0.
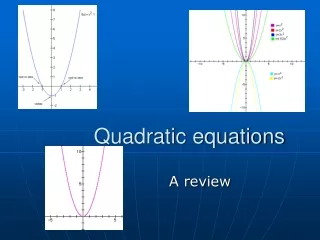
To graph a Quadratic Equation y = ax2+bx+c y = -ax2+bx+c If a is positive, the parabola opens up If a is negative, the parabola opens down
Graph Points Line of symmetry A is positive 1, so the parabola opens up with (0,0) as the low point.
GRAPH: y = x2-x-6 • Identify the a, b, and c values • First find the vertex • Make a table with an x value to the right and left of the vertex x value • Graph these points and connect. • Label the vertex
Find vertex and plug in to find y. value to have high or low point. 1.
The x value of the vertex is 1/2 • Now find the y value of the vertex by plugging x back into the equation. y = x2-x-6 • y = (1/2)2 – ½ - 6 • The y value is -25/4. • Now pick a point to the left and right of ½.
y = x2-x-6 GRAPH: I try to pick points equal distance from the vertex x value. I also tried 0 here.
Y=x2-x-6 Vertex low opens up (a positive) line of symmetry x =
Graph:y= -2x2+2x+1 a is negative-opens down Line of Symmetry Find the y value, then pick a point to the left and right of 1/2 to see how to draw the parabola. = 1 2
2 - - 2 - 2 2 -
Use parabola to find the height of a shot put. Vertex is height Height in feet 34.15 Distance in feet
Equation: y= -.01464x2+x+5 USE CALCULATOR!
Put x back in to find y value y = -.01464(34.15)2+34.15+5 = 22.08 ft. high (34.15,22.08) vertex (high point)