Download
1 / 1
10 likes | 73 Views
A B. Ma-Mel -48a. Ma-Mel -48b. Ma-Mel -48c. - + - + - + IFN- . JAK1. STAT1. pSTAT1. HLA-A HLA-B HLA-C B2M.

E N D
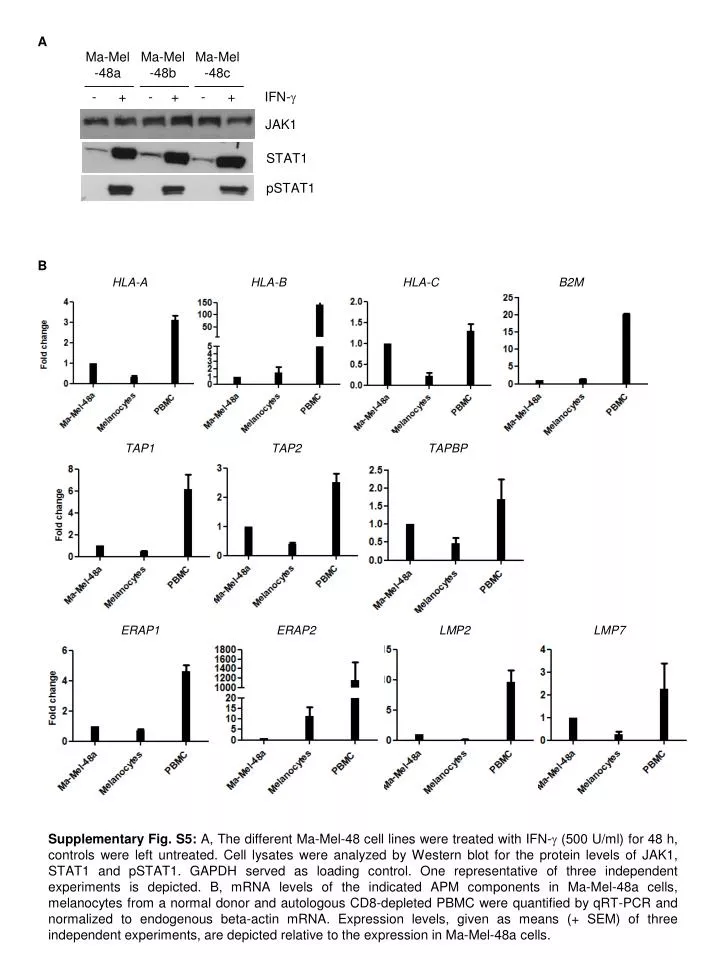
A B Ma-Mel -48a Ma-Mel -48b Ma-Mel -48c - + - + - + IFN- JAK1 STAT1 pSTAT1 HLA-A HLA-B HLA-C B2M TAP1 TAP2 TAPBP ERAP1 ERAP2 LMP2 LMP7 Supplementary Fig. S5: A, The different Ma-Mel-48 cell lines were treated with IFN- (500 U/ml) for 48 h, controls were left untreated. Cell lysates were analyzed by Western blot for the protein levels of JAK1, STAT1 and pSTAT1. GAPDH served as loading control. One representative of three independent experiments is depicted. B, mRNA levels of the indicated APM components in Ma-Mel-48a cells, melanocytes from a normal donor and autologous CD8-depleted PBMC were quantified by qRT-PCR and normalized to endogenous beta-actin mRNA. Expression levels, given as means (+ SEM) of three independent experiments, are depicted relative to the expression in Ma-Mel-48a cells.