Download
1 / 16
160 likes | 339 Views
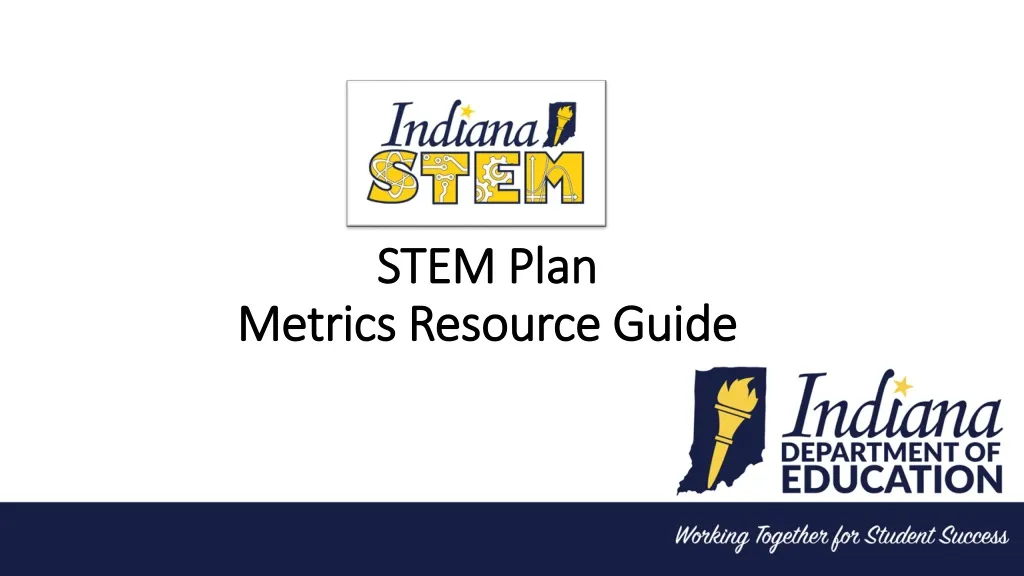
STEM Plan Metrics Resource Guide. Metrics to Consider. Goal #1 : By investing in the recruitment, development and retention of STEM educators, Indiana will increase the number of STEM ready educators by a minimum of 10% by 2025. STEM Ready Educator Licenses and Trainings.

E N D
Metrics to Consider Goal #1: By investing in the recruitment, development and retention of STEM educators, Indiana will increase the number of STEM ready educators by a minimum of 10% by 2025.
STEM Ready Educator Licenses and Trainings *Metrics for each category still being determined • Computer Science • Tech Ed • Computer Programming • Information Technology • Math • Science • Engineering • Workplace Specialists • Provider-specific Trainees
Metrics to Consider Goal #2: Increase science proficiency for all students in 4th and 6th grade by 10 percentage points and increase math proficiency by 10 percentage points for all students in grade 3-8 by 2025.
2016-17, Grade 4 Science ISTEP+ Pass Rates 36.3% 63.7% 63.7%
2016-17, Grade 6 Science ISTEP+ Pass Rates 37.3% 62.7% 62.7%
2016-17, Grade 4 & 6 Science ISTEP+ Pass Rates, Ethnicity 4th Grade 6th Grade
2016-17, Grade 4 & 6 Science ISTEP+ Pass Rates, F/R Status 6th Grade 4th Grade
2016-17, Math ISTEP+ Pass Rates, Grades 3-8 41.5% 58.5% 58.5%
Metrics to Consider Goal #3: By nurturing effective school-community partnerships within K-12 education programs across the State and aligning education to business and industry needs, we will strengthen the education to career pipeline as evidenced by a 10% growth rate of the number of secondary students entering into STEM related career pathways and in the matriculation of high school graduates to STEM related careers or postsecondary fields of study by 2025.
Working Together for Student Success @suptdrmccormick @EducateIN