Download
1 / 26
260 likes | 265 Views
black. white. males. 20 observ. 2 obs. females. 3 obs. 24 obs. Independent variables correlate with each other - a possibility for mediated correlation, direct and mediated effect; - shoe size and food consumption – we know; - body size and stomach volume – we do not know;

E N D
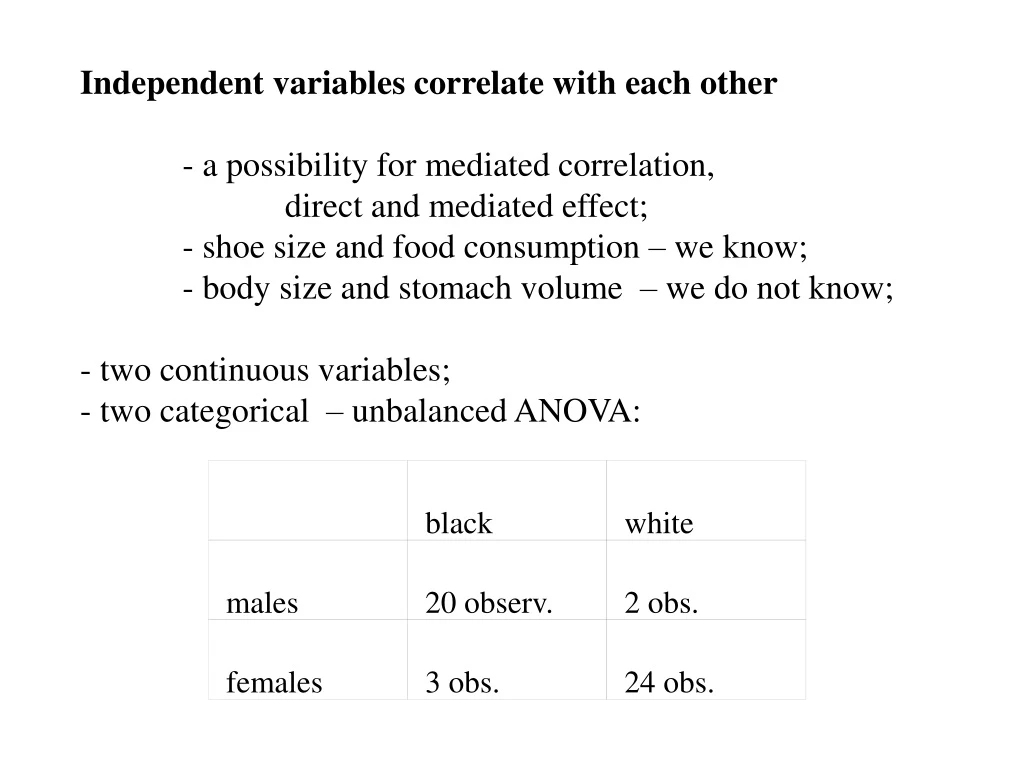
black white males 20 observ. 2 obs. females 3 obs. 24 obs. Independent variables correlate with each other - a possibility formediated correlation, direct and mediated effect; - shoe size and food consumption – we know; - body size and stomach volume – we do not know; - two continuous variables; - two categorical – unbalanced ANOVA:
Statistics cannot answer the question which variable has a direct effect and which has an indirect (mediated) effect, and to which extent but we can divide the variance into components. 1) the part which can certainly be ascribed to one variable; 2) the part which can certainly be ascribed to the other variable; 3) the part which we do not know how to divide; the last part is the larger the stronger is the correlation.
Height of the plants as dependent on 1) temperature; 2) humidity Let’s asume that temperature and humidity correlate with each other, ... we are on the southern margin of a desert: temperature humidity
plant height plant height humidity temperature Studying one by one there is no doubt that plant height depends on both humidity and temperature, but does humidity have such an effect which cannot be explained by its correlation with temperatuure? (is direct, not mediated)? but does temperatuure have such an effect? .... we include them both to an ANOVA model as independent variables, but there are several ways... dividing SS
Type I analysis or type I sums of squares all the grey area is assigned to this variable which appears first in the model, estimates the maximal effect; conservative with respect to the second variable – estimates what is “certainly its own effect“, estimates the minimal effect. Humidity as the first variable: DF Type I SS F P humidity 1 2164 32.30 0.0023 temperature 1 142 2.13 0.2045 .... we cannot claim that temperature has a direct effect.
Temperature as the first variable: Source DF Type I SS F p temperature 1 1886 28.1 0.0032 humidity 1 420 6.28 0.0541 We cannot claim a direct (not mediated by temperature) effect of humidity. And now type III – conservative with respect to both! DF Type III SS F P temperatuur 1 142.5 2.13 0.2045 niiskus 1 420.8 6.28 0.0541
In Type I, the order is important, in type III is not! The danger with type III – joint explanatory power may remain undetected! Do it for yourself in diferent ways, present type III if it reflects the reality! Otherwise you must explain. If the variables are not correlated (ANOVA is balanced) then there is no difference! and also for a one-way analysis. Type II and IV also exist. Avoid when possible, but always you cannot!
Covariates in an experiment- direct and indirect effect Effect of crowding on moth fecundity, via body weight, or is there something else? Taking weight as a covariate! Including the covariate changes the interpretation! manipulation: rearing in groups pupal weight fecundity of the moths
Multiple regression height = 0,597*temp + 0,089*light + 0,196*humidity - 0.12 Non-linear regression y = sin(ax + c(log(x))bx - which function to choose? - know from theory? - what can we conclude? - properties of the function, not supported by the data. - OK to describe. Usually enough to study if it deviates from linearity, - including the squared term: positive or negative; - fitting a parabola.
Type II regression: • when we want to conclude something from the value of the slope; • type I regression for predicting, not to estimate the „real“ relationship, • to evaluate the relationship; - different equations for different directions of the prediction; Equation does not depend on switching the axes! Geometric mean regression - geometric mean of slopes both ways; - does not matter if only the existence of a relationship is of interest!
Variations of ANOVA: - hierarchical (nested); - random factors; - repeated measures;
Nested (hierarchical) ANOVA the effect of a factor is „allowed“ to differ at different levels of another factor; one factor is nested within another: in bracketsB(A): Does tail length depend on sex? An usual ANOVA DF Type III SS F P sex 1 0.333 0.05 0.82 species 1 0.333 0.05 0.82 but now sex nested within species: sex 1 0.333 0.16 .69 sex(species) 2 40.66 9.76 .0071 ..... classes in schools: class(school); .... subpopulations, experimental design, covariates.
ANOVA with random factors a random factor is such an independent variable, the levels of which can be seen as a sample from a large population of levels. - brood For fixed factors, all levels are represended in our sample: - treatment; - sex. We can also say that, for random factors, the error variance is at two levels: - the variation of individual observations around brood means; - the variation of brood means around the grand mean.
We study the dependence of the size of oak leaf on temperatuure. Which are random factors: - tree individual; - branch in a tree; - season (summer etc.); - grove (forest fragment); - habitat (forest/ open land); - year. Can depend on question asked: do we study the difference between these populations or do we want to generalize the results to all populations (of Estonia?) When is random, can be generalized!
Fixed effects ANOVA, random effects ANOVA, mixed ANOVA. no difference for one-way ANOVA. A two-way ANOVA (one factor mixed, one random), difference is modest when there are no interactions; with interactions the difference can be large! - 6 broods, 2:4:how in the whole population? Do not know. the difference is mostly in the effect of the fixed factor!
manipulation brood effect brood fixed: Type 3 Tests of Fixed Effects Num Den Effect DF DF F Value Pr > F trea 1 24 6.10 0.0211 brood 5 24 23.70 <.0001 trea*brood 5 24 11.12 <.0001
manipulation brood effect brood random: Type 3 Tests Num Den Effect DF DF F Value Pr > F trea 1 24 0.55 0.4924 brood 5 24 2.13 0.213 trea*brood 5 24 11.12 <.0001
manipulation brood effect brood fixed: Type 3 Tests of Fixed Effects Num Den Effect DF DF F Value Pr > F trea 1 24 7.76 0.0103 brood 5 24 12.31 <.0001 trea*brood 5 24 0.39 0.8486
manipulation brood effect brood random: Type 3 Tests Num Den Effect DF DF F Value Pr > F trea 1 24 19.74 0.0067 brood 5 24 31.32 0.0009 trea*brood 5 24 0.39 0.8486
not always there is a right and a wrong way to analyze; • should be a number of levels; - should group the observations, not the observation itself!
population weight
Repeated measures ANOVA - one individual (or something else) has been measured several times; Should not be treated in an usual way : - overestimate the number of df – pseudoreplications!; - do not take the individuality into account. REPEATED measurements ANOVA will help! 1. dependent samples t-test; 2. dependence of the weight of lice on bear fur thickness; 3. birds are fed with different food, parasitism index are counted, all birds measured four times, time*trea interaction is of interest.