1 / 3

レベル測定結果(H21.2.28) 6 測線、 50 cmピッチ、レベル測量   高さは、護岸上を DL+300cm とした相対値です   レベルのコンターは10cm毎

レベル測定結果(H21.2.28) 6 測線、 50 cmピッチ、レベル測量   高さは、護岸上を DL+300cm とした相対値です   レベルのコンターは10cm毎   段差は、 4.25 mおよび、 10.0 mのところにあります。. 0m 4m         10m   12 m. レベル測定結果の比較(H21.2.28-1.25)   右図は、 2 回の測定を補間し、差を取った高さ(cm)を示しています。   着色域は、 1.5cm 以上の堆積(青)、 1.5cm の浸食(赤)を示します。

chase
Download Presentation

レベル測定結果(H21.2.28) 6 測線、 50 cmピッチ、レベル測量   高さは、護岸上を DL+300cm とした相対値です   レベルのコンターは10cm毎

An Image/Link below is provided (as is) to download presentation Download Policy: Content on the Website is provided to you AS IS for your information and personal use and may not be sold / licensed / shared on other websites without getting consent from its author. Content is provided to you AS IS for your information and personal use only. Download presentation by click this link. While downloading, if for some reason you are not able to download a presentation, the publisher may have deleted the file from their server. During download, if you can't get a presentation, the file might be deleted by the publisher.

E N D

Presentation Transcript


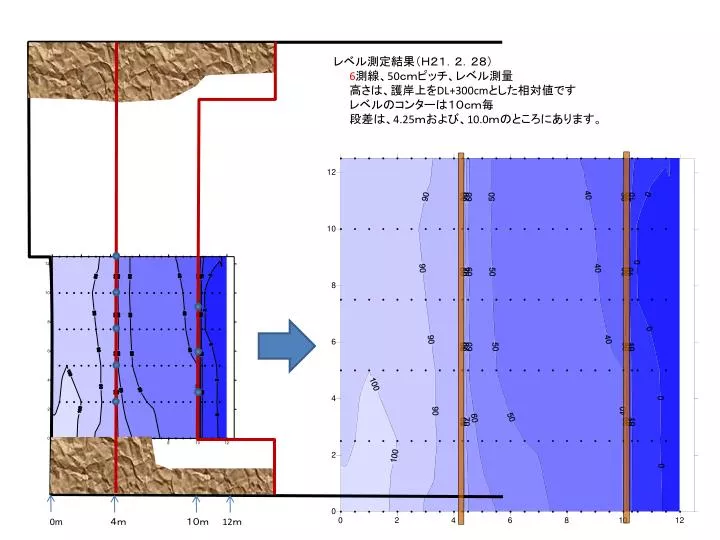
  1. レベル測定結果(H21.2.28) 6測線、50cmピッチ、レベル測量   高さは、護岸上をDL+300cmとした相対値です   レベルのコンターは10cm毎   段差は、4.25mおよび、10.0mのところにあります。 0m 4m         10m  12m

  2. レベル測定結果の比較(H21.2.28-1.25)レベル測定結果の比較(H21.2.28-1.25)   右図は、2回の測定を補間し、差を取った高さ(cm)を示しています。   着色域は、1.5cm以上の堆積(青)、1.5cmの浸食(赤)を示します。   段差は、4.25mおよび、10.0mのところにあります。   全体として堆積傾向ですが、変化は小さくおおむね5cm以内です。

  3. H20.4.20         H20.6.1          H20.6.22           H20.7.19        H20.8.17H20.4.20         H20.6.1          H20.6.22           H20.7.19        H20.8.17 H20.9.27         H20.10.12         H20.11.16         H20.12.14        H21.1.25 • レベル測定結果の比較(H20.4.20-21.2.28) • 4月20日の予備計測から、第10回観測の2月28日までの測定結果一覧です。 • 着色域は、1.5cm以上の堆積(青)、1.5cmの浸食(赤)を示します。 • 段差は、4.25mおよび、10.0mのところにあります。 • 全体として変化が小さく、おおむね15cm以内の浸食(厚密?)傾向です。 H21.2.28

More Related