Download
1 / 13
140 likes | 149 Views
Chapter 3. Graphs and Functions. Chapter Sections. 3.1 – Graphs 3.2 – Functions 3.3 – Linear Functions: Graphs and Applications 3.4 – The Slope-Intercept Form of a Linear Equation 3.5 – The Point-Slope Form of a Linear Equation 3.6 – The Algebra of Functions

E N D
Chapter 3 Graphs and Functions
Chapter Sections 3.1 – Graphs 3.2 – Functions 3.3 – Linear Functions: Graphs and Applications 3.4 – The Slope-Intercept Form of a Linear Equation 3.5 – The Point-Slope Form of a Linear Equation 3.6 – The Algebra of Functions 3.7 – Graphing Linear Inequalities
Graphs § 3.1
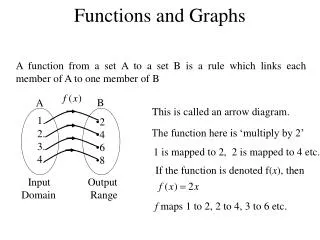
Definitions A graphshows the relationship between two variables in an equation. The Cartesian (rectangular) coordinate systemis a grid system used to draw graphs. It is named after its developer, René Descartes (1596-1650).
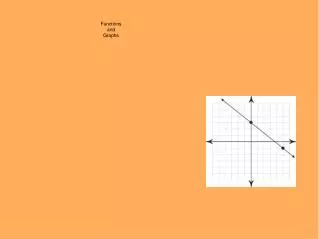
y x Definitions II I III IV The two intersecting axis form four quadrants,numbered I through IV. The horizontal axis is called the x-axis. The vertical axis is called the y-axis.
y x Definitions Origin (0, 0) The point of intersection of the two axes is called the origin. The coordinates, or the value of the x and the value of the y determines the point. This is also called an orderedpair.
Plotting Points Starting at the origin, move 3 places to the right. Plot the point (3, -4). The x-coordinate is 3 and the y-coordinate is –4.
Plotting Points Then move 4 places down. Plot the point (3, -4). The x-coordinate is 3 and the y-coordinate is –4.
Plotting Points (3, -4) Plot the point (3, -4). The x-coordinate is 3 and the y-coordinate is –4.
Linear Equations A linear equation in two variablesis an equation that can be put in the form ax + by = c where a, b, and c are real numbers. This is called the standard formof an equation. Examples: 4x – 3y = 12 x + 2y = -35
Solutions to Equations The solutionto an equation is the ordered pair that can be substituted into the equation without changing the “validity” of the equation. Is (3, 0) a solution to the equation 4x – 3y = 12? 4x – 3y = 12 4(3) – 3(0) = 12 12 – 0 = 12 12 = 12 Yes, it is a solution.
Graphing A graphof an equation is an illustration of the set of points whose ordered pairs are solutions to the equation. A set of points that are in a straight line are collinear. The points (-1, 4), (1, 1) and (4, -3) are collinear.
Graph Nonlinear Equations Equations whose graphs are not straight lines are called nonlinear equations. Example: Graph y = x2 – 4. Use the following values for x: -3, -2, -1, 0, 1, 2, and 3.