Download
1 / 55
620 likes | 905 Views
FEM analysis of Surface Acoustic Wave resonators of Piezoelectric Gallium Nitride on Silicon substrate for frequencies above 5 GHz. Athanasios Margiolakis University of Crete 2012. Purpose.

E N D
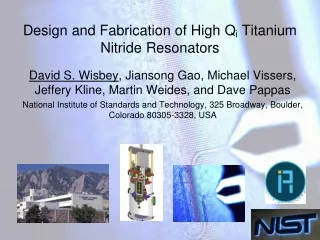
FEM analysis of Surface Acoustic Wave resonators of Piezoelectric Gallium Nitride on Silicon substrate for frequencies above 5 GHz AthanasiosMargiolakis University of Crete 2012
Purpose The purpose of this work is to develop an accurate numerical methodology that simulates SAW resonators for use with new technologies on wireless connections and telecommunications above 5 GHz
Index Introduction Theory of SAW devices Simulations (finite element method) Fabrication Characterization Results
IntroductionTheory Simulation Fabrication Characterization ResultsIntroductionTheory Simulation Fabrication Characterization Results Surface Acoustic Wave (SAW) • Acoustic wave on surface of a material exhibiting elasticity • Amplitude decays exponentially with depth into the substrate • Generated by piezoelectric material stimulated by electrodes
Introduction Theory Simulation Fabrication Characterization ResultsIntroduction Theory Simulation Fabrication Characterization Results IntroductionTheory Simulation Fabrication Characterization Results Piezoelectric materials • Charge accumulates when force is applied • Deforms when electrical field is applied
Introduction Theory Simulation Fabrication Characterization ResultsIntroduction Theory Simulation Fabrication Characterization Results IntroductionTheory Simulation Fabrication Characterization Results Interdigital Transducers (electrodes) • Alternating electric potential on IDTs is applied • Electric field on piezoelectric material under IDTs • Piezoelectric deforms creating waves • Waves with wavelength similar to IDT dimensions survive
Introduction Theory Simulation Fabrication Characterization ResultsIntroduction Theory Simulation Fabrication Characterization Results IntroductionTheory Simulation Fabrication Characterization Results SAW propagation animation
Introduction Theory Simulation Fabrication Characterization ResultsIntroduction Theory Simulation Fabrication Characterization Results IntroductionTheory Simulation Fabrication Characterization Results Using SAW Frequency control f=υ/λ • Dimensions of IDTs Wavelengthλ • Material properties Wave propagation speedυ
Introduction Theory Simulation Fabrication Characterization ResultsIntroduction Theory Simulation Fabrication Characterization Results IntroductionTheory Simulation Fabrication Characterization Results SAW Devices • SAW filters - Frequency filter Used in telecommunications and wireless applications SAW Filters • Mobile telephones • Radio receivers SAW Resonators • Radio Transmitters • Remote controls • Radio links • No channelization devices
Introduction Theory Simulation Fabrication Characterization ResultsIntroduction Theory Simulation Fabrication Characterization Results IntroductionTheory Simulation Fabrication Characterization Results SAW devices • SAW sensors – using SAW propagation speed SAW Sensors • Chemical • Optical • Thermal • Pressure • Acceleration • Torque • Biological
Introduction Theory Simulation Fabrication Characterization ResultsIntroduction Theory Simulation Fabrication Characterization Results IntroductionTheory Simulation Fabrication Characterization Results Advantages • SAW have better • Performance • Cost • Size • Compared to other technologies such as • quartz crystals • LC filters • waveguide filters
Introduction Theory Simulation Fabrication Characterization ResultsIntroduction Theory Simulation Fabrication Characterization Results IntroductionTheory Simulation Fabrication Characterization Results Why above 5 GHz • Current commercial telecommunication filter technology limited to 5 GHz • Need for new technologies above 5 GHz • Faster data transfers at higher frequencies • Better performance filters (higher Q factor) • Commercial products like WiMAX(2-11 GHz) and 4G mobile networks require higher frequencies
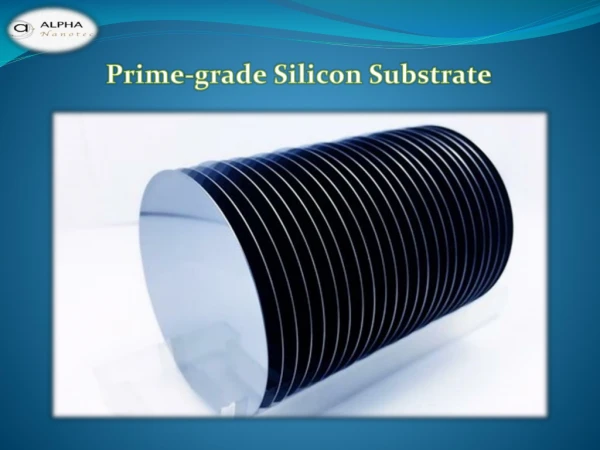
Introduction Theory Simulation Fabrication Characterization ResultsIntroduction Theory Simulation Fabrication Characterization Results IntroductionTheory Simulation Fabrication Characterization Results Materials • Substrate material • Silicon (Si) with diamond cubic structure, structural and electric properties highly anisotropic. • Piezoelectric layer • Gallium Nitride (GaN) is a binary III/V direct bandgap semiconductor with Wurtzite crystal structure
Introduction Theory Simulation Fabrication Characterization ResultsIntroduction Theory Simulation Fabrication Characterization Results IntroductionTheory Simulation Fabrication Characterization Results Material benefits • Gallium Nitride (for piezoelectric material) • Can be monolithically fabricated on microelectronic devices • GaN SAW material is superior to other existing materials • Silicon (for substrate material) • Most common and low cost material for such applications
IntroductionTheory Simulation Fabrication Characterization ResultsIntroductionTheory Simulation Fabrication Characterization Results Why Numerical modeling • Need to accurately determine resonant frequencies • Complex and non-linear problem • Analytical methods not accurate • Need for higher frequencies lead to dimension reduction • Stronger effects of IDT dimensions and geometry on resonant frequencies • Modeling using numerical methods • Finite Element Method (FEM) analysis
Introduction Theory Simulation Fabrication Characterization ResultsIntroduction Theory Simulation Fabrication Characterization Results Mechanical motion of SAW Physical motion is time dependent elliptical displacement of the surface. The unbounded direction (y-axis) vibrates more than the bounded (x-axis). Amplitudes become negligible for penetration depths greater than few acoustic wavelengths λ(=ν/f)
Introduction Theory Simulation Fabrication Characterization ResultsIntroduction Theory Simulation Fabrication Characterization Results Introduction Theory Simulation Fabrication Characterization Results Stress and Strain • T=F/A Stress T is the force F applied per unit area A of the solid. • S=ΔL/L Strain S is fractional deformation ΔL of solid length L T=cSc = elastic stiffness, Young’s modulus (N/m²) tensor equation, , j denotes direction of force F, k direction of vector of area A Likewise deformation directions defined similarly.
Introduction Theory Simulation Fabrication Characterization ResultsIntroduction Theory Simulation Fabrication Characterization Results Introduction Theory Simulation Fabrication Characterization Results Piezoelectric interactions The E established by V will distort the molecular charge distribution and result in accumulation of surface charge. Electrical displacement density matrix equation piezoelectric constant, electric field intensity, dielectric permittivity
Introduction Theory Simulation Fabrication Characterization ResultsIntroduction Theory Simulation Fabrication Characterization Results Introduction Theory Simulation Fabrication Characterization Results General equations of surface waves S = Strain T = Stress ρ = mass density u = mechanical displacement D = displacement density E = electric field intensity Φ = electric potential
Introduction Theory Simulation Fabrication Characterization ResultsIntroduction Theory Simulation Fabrication Characterization Results Introduction Theory Simulation Fabrication Characterization Results IDT types • Single-electrode • Basic IDT type • Split-electrode • reduce undesirable finger reflection effects • reflections from each split-electrode pair cancel out at center frequency • requires increased lithographic resolution • DART (Distributed Acoustic Reflection Transducer) • Variable reflectivity can be achieved to give greater design capability • Reduce pass band ripples
Introduction Theory Simulation Fabrication Characterization ResultsIntroduction Theory Simulation Fabrication Characterization Results Modeling SAW device • Early SAW filter models (analytical solution) • Delta function • Crossed-Field • Impulse-response • Analytic method • Know absolutely how the model will behave • Works only for simple models • Linearized approximation • Other analytical methods for SAW design • Equivalent circuit model • S-matrix model • P-matrix model • Coupling-of-modes
Introduction Theory Simulation Fabrication Characterization ResultsIntroduction Theory Simulation Fabrication Characterization Results Introduction Theory Simulation Fabrication Characterization Results Finite Element Method • Nanosized SAW devices require numerical simulations Initial values of the variables equations new values over small Δt • FEM is dividing up a problem into small elements that can be solved in relation to each other • Benefits of FEM for SAW modeling • domain changes, precision varies over the entire domain, solving complex elasticity problems • ComsolMultiphysicsplatform Solves a set of differential equations on grid using FEM
Introduction Theory Simulation Fabrication Characterization ResultsIntroduction Theory Simulation Fabrication Characterization Results Introduction Theory Simulation Fabrication Characterization Results Geometry design • Non-linear model with high computational requirements For typical 2-port SAW resonator, delay line 1000λ, aperture 500λ, depth 10λ, minimum 20first order elements per wavelength = 108elements Four degrees of freedom, displacement (Ux,Uy,Uz) and potential (φ) Total number of unknowns = 4×10⁸
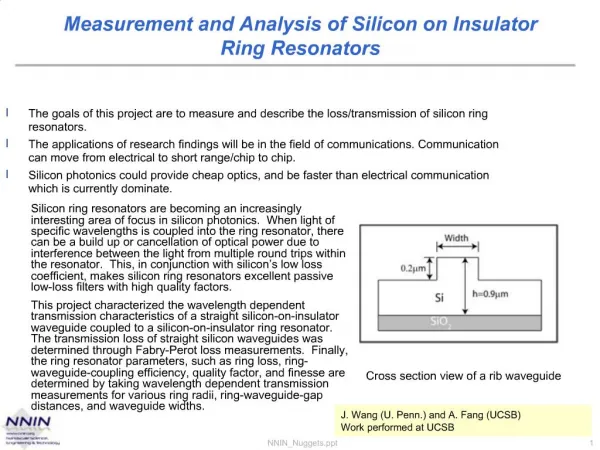
Introduction Theory Simulation Fabrication Characterization ResultsIntroduction Theory Simulation Fabrication Characterization Results Introduction Theory Simulation Fabrication Characterization Results Approach of the model • Reducing the size of the models dimensions • Dimension in the direction that the wave propagates is one wavelength • Dimension of perpendicular to motion is discarded due to the shape of IDTs • The depth of the substrate is set to 10 wavelengths of resonance frequency • Si substrate height 10 μm • GaN piezoelectric layer 1.6 μm • IDT electrode height 80 nm • IDT width, p=130 nm , 200 nm p
Introduction Theory Simulation Fabrication Characterization ResultsIntroduction Theory Simulation Fabrication Characterization Results Introduction Theory Simulation Fabrication Characterization Results Complete/Unit cell model • Comparing the two models For 1 hour of simulation of the compact model 50 years of simulations are needed for the complete model Compact model used 4 GB of RAM For the complete model 2 PB of RAM would be needed.
Introduction Theory Simulation Fabrication Characterization ResultsIntroduction Theory Simulation Fabrication Characterization Results Introduction Theory Simulation Fabrication Characterization Results Model Parameters • Boundary conditions (b.c.) • Periodic boundary conditions are defined on both sides of the substrate • Stress-free boundary conditions for the surface and the electrodes • Piezoelectric and substrate have “zero charge/symmetry” electric b.c. • Electrodes are grounded or have 1 Volt electric potential • Subdomain (material properties) Young’s Modulus, Poisson’s ratio, density, thickness, elasticity matrix, coupling matrix, relative permittivity and electric conductivity of substrate material and piezoelectric layer
Introduction Theory Simulation Fabrication Characterization ResultsIntroduction Theory Simulation Fabrication Characterization Results Introduction Theory Simulation Fabrication Characterization Results Model Parameters In finite element model problem domain is discretized in smaller regions, called elements, connected at nodes • Mesh • Detail of mesh has major effect in simulation time • Finer elements are used closer to the surface for better accuracy • Bulkier elements to the bottom for faster calculations
Introduction Theory Simulation Fabrication Characterization ResultsIntroduction Theory Simulation Fabrication Characterization Results Introduction Theory Simulation Fabrication Characterization Results Model Parameters • Substrate thickness • Small values decrease the accuracy of the simulation • Large values increase the computational time • Values of few wavelengths provide fast and accurate results • Height of 7 wavelengths were used
Introduction Theory Simulation Fabrication Characterization ResultsIntroduction Theory Simulation Fabrication Characterization Results Introduction Theory Simulation Fabrication Characterization Results Model Parameters • IDT width and in between spacing (p) • Define the wavelength of the resonant frequency • SAW topologies • Single electrode • Split-electrode • DART p Single-electrode model Split-electrode model
Introduction Theory Simulation Fabrication Characterization ResultsIntroduction Theory Simulation Fabrication Characterization Results Introduction Theory Simulation Fabrication Characterization Results • Resonance at 7.96 GHz with electric potential and total displacement maps plottedrespectively, for Single-electrode IDT with 130 nm finger width.
Introduction Theory Simulation Fabrication Characterization ResultsIntroduction Theory Simulation Fabrication Characterization Results Introduction Theory Simulation Fabrication Characterization Results • Resonance at 5.49 GHz, for Single-electrode IDT with 200 nm finger width.
Introduction Theory Simulation Fabrication Characterization ResultsIntroduction Theory Simulation Fabrication Characterization Results Introduction Theory Simulation Fabrication Characterization Results • Resonance at 2.79 GHz, of Split-electrode type IDT with 200 nm finger width.
Introduction Theory Simulation Fabrication Characterization ResultsIntroduction Theory Simulation Fabrication Characterization Results Introduction Theory Simulation Fabrication Characterization Results • Resonance at 2.08 GHz, of DARTtype IDT with 200 nm finger width.
Introduction Theory Simulation Fabrication Characterization ResultsIntroduction Theory Simulation Fabrication Characterization Results Introduction Theory Simulation Fabrication Characterization Results • Resonance at 5.49 GHz, of DARTtype IDT with 200 nm finger width. • DART array with multiple resonant wavelengths for the same IDT dimensions
Introduction Theory Simulation Fabrication Characterization ResultsIntroduction Theory Simulation Fabrication Characterization Results IDT fabrication process Employing PMMA resist of 200 nm thickness on a Gallium Nitride wafer Direct electron beam lithography writing A metal layer of Ti/Au (5 nm/75 nm) was subsequently deposited on wafer using an e-beam evaporator Followed by a lift-off procedure to form the interdigitatedelectrodes(IDTs) Materials used for fabrication
Introduction Theory Simulation Fabrication Characterization ResultsIntroduction Theory Simulation Fabrication Characterization Results Introduction Theory Simulation Fabrication Characterization Results Photolithography mask • Photolithography mask that was used, with different IDT characteristics • Variable delay lines • IDT finger lengths • Crystal orientation • Reflectors exist or not
Introduction Theory Simulation Fabrication Characterization ResultsIntroduction Theory Simulation Fabrication Characterization Results Introduction Theory Simulation Fabrication Characterization Results Fabrication • Mix and Match fabrication • IDTs were fabricated in “IMT” using e-beam lithography (gold) • Rest of the device elements were fabricated in “FORTH” using conventional optical lithography (green)
Introduction Theory Simulation Fabrication Characterization ResultsIntroduction Theory Simulation Fabrication Characterization Results Introduction Theory Simulation Fabrication Characterization Results Post fabrication images of the devices Complete IDT structure with connecting pads at magnification x130 IDT fingers with reflectors at magnification x3000 Single electrode IDT type magnification x50000
Introduction Theory Simulation Fabrication Characterization ResultsIntroduction Theory Simulation Fabrication Characterization Results Introduction Theory Simulation Fabrication Characterization Results Post fabrication images of the devices Single electrode type IDT array, finger width 130nm and metallization ratio η=0.5 Split electrode type IDT array, finger width 200nm and metallization ratio η=0.5 DART type IDT array, finger width 200nm and metallization ratio η=0.5
Introduction Theory Simulation Fabrication Characterization Results Characterization Signal Ground • A couple of three finger probes were placed on the pads of the IDTs • The middle electrode was grounded and the upper/bottom were put to 1 Volt electric potential • A frequency scan performed from 2 to 9 GHz depending the IDT type.
Introduction Theory Simulation Fabrication Characterization ResultsIntroduction Theory Simulation Fabrication Characterization Results Introduction Theory Simulation Fabrication Characterization Results S-parameters • Scattering (S) parameters describe the response of an N-port network to voltage signals at each port • The first number refers to responding port, while second to incident port. S21 means response at port 2 due to signal at port 1 • For 2-port network, incident voltage denoted by “a”, leaving by “b”
Introduction Theory Simulation Fabrication Characterization ResultsIntroduction Theory Simulation Fabrication Characterization Results Introduction Theory Simulation Fabrication Characterization Results Y-parameters Admittance (Y) is a measure of how easily a circuit or device will allow a current to flow.It is the inverse of the impedance. Y-parameters describe the small-signal response of non-linear networks. For all ports the currents may be defined in terms of the Y-parameter matrix and the voltages I = YVY is an N × N matrix 2-port network transformation from S-parameters to Y-parameters Y0 characteristic admittance
Introduction Theory Simulation Fabrication Characterization ResultsIntroduction Theory Simulation Fabrication Characterization Results Introduction Theory Simulation Fabrication Characterization Results Simulated with measured results comparison The simulations for the Single-electrodes with 200nm width had a frequency drift of 187 MHz to lower frequencies that is 3.29% difference from the characterized device. Ripples occur from interference of the reflections
Introduction Theory Simulation Fabrication Characterization ResultsIntroduction Theory Simulation Fabrication Characterization Results Introduction Theory Simulation Fabrication Characterization Results Simulated with measured results comparison The simulations for the Single-electrodes with 130nm width had a frequency drift of 184 MHz to lower frequencies that is 2.25% difference from the characterized device.
Introduction Theory Simulation Fabrication Characterization ResultsIntroduction Theory Simulation Fabrication Characterization Results Introduction Theory Simulation Fabrication Characterization Results Simulated with measured results comparison The simulations for the Split-electrodes with 200nm finger width had a frequency drift of 343 MHz to higher frequencies that is 4.14% difference from the characterized device.
Introduction Theory Simulation Fabrication Characterization ResultsIntroduction Theory Simulation Fabrication Characterization Results Introduction Theory Simulation Fabrication Characterization Results Simulated with measured results comparison The simulations of the Split-electrodes with 200nm width for a wider frequency spectrum had a harmonic resonance drift of 73 MHz to lower frequencies that is 3.42% difference from the characterized device. The main resonant frequency was compared in the previous figure.
Introduction Theory Simulation Fabrication Characterization ResultsIntroduction Theory Simulation Fabrication Characterization Results Introduction Theory Simulation Fabrication Characterization Results Simulated with measured results comparison The simulations for the DART electrodes with 200nm width had a frequency drift of 185 MHz to lower frequencies that is 3.25% difference from the characterized device.
Introduction Theory Simulation Fabrication Characterization Results Conclusions • Efficient numerical methodology for determination of fs • SAW devices (GaN/Si) designed and implemented with fs up to 9GHz • Measured fsto predicted fsdeviation in the order of 3% • Further improvement of the predictability of resonant frequency with reasonable cost in computational time
Acknowledgements • I would like to thank • Alexandra Stefanescu • Dan Neculoiu • Mircea Dragoman • Adrian Dinescu • George Konstantinidis • Eleftherios Iliopoulos • AlexandrosPantazis • PanosTzanetakis • AlexandrosGeorgakilas ΠΑΡ00195-1 for the financial support