Download
1 / 10
100 likes | 178 Views
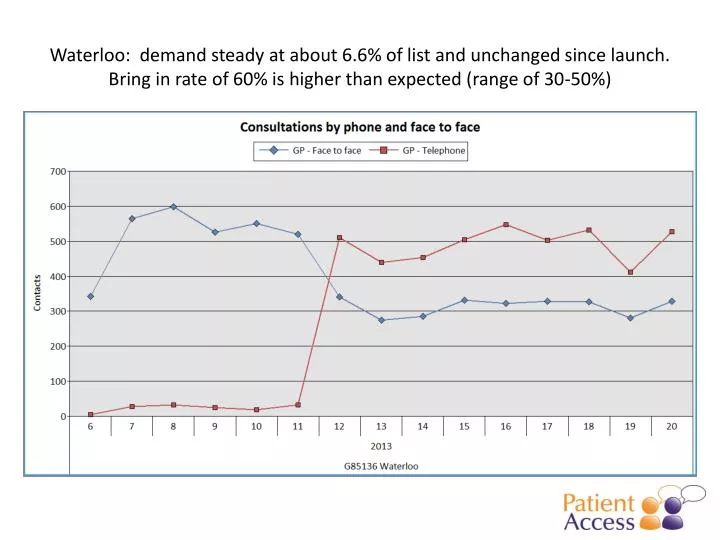
Waterloo: demand steady at about 6.6% of list and unchanged since launch. Bring in rate of 60% is higher than expected (range of 30-50%). Wait to see a GP, average days, has dropped 60% from 2.2 to 0.8, and speaking to a GP is almost entirely same day.

E N D
Waterloo: demand steady at about 6.6% of list and unchanged since launch. Bring in rate of 60% is higher than expected (range of 30-50%)
Wait to see a GP, average days, has dropped 60% from 2.2 to 0.8, and speaking to a GP is almost entirely same day.
82% of patients are now seen on the same day, improvement on 68% before. Expect 80-90%.
Frequency distribution of waiting days to see or speak to GP.May find that over time those booking ahead fall even further. Best to get all phonecalls dealt with on same day
Response times: small sample of data but looks like a good start, most answered quickly and median time of 19 mins is excellent.
Pattern of demand still shows a tapering down from busier mornings to very little late afternoon. This is probably stable, excellent.
Loadmaster by hour: Monday morning higher, all show tapering pattern
Need to match GP availability by day to expected demand, phone and f2f. Mondays in most practices are higher.
Continuity at 87% looks OK. Well worth preserving or enhancing.Note: this is a very short series so not fully reliable data.
Summary findings – savings lie in bring in rate. • Service greatly improved since launch, waiting days cut by 60% and now 82% of patients seen same day. • Pattern of work changed, same patient demand dealt with and 40% less f2f. • Continuity holding up well, has been known to improve but starting from a good base. • Pattern of demand through the day tapers downwards. This is normal and speaks of patients used to good access even before the launch. • Use Loadmaster chart to plan rotas and get on top of demand – at 6.6% of list it is moderate overall. • The big time saving potential is in the bring in rate. At 60% it is higher than expected, and with growing confidence we would expect this to be in the range of 30-50%.