Download
1 / 11
150 likes | 557 Views
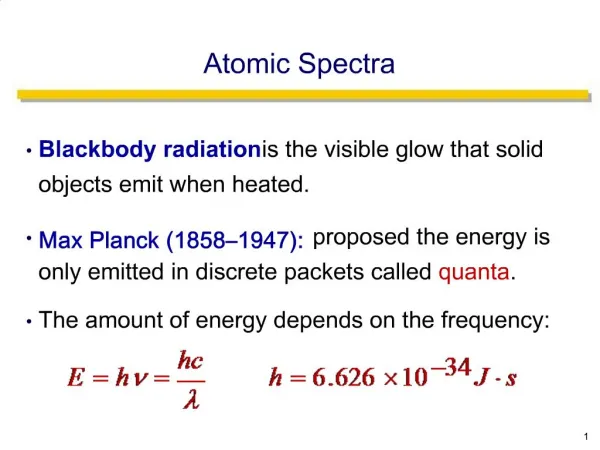
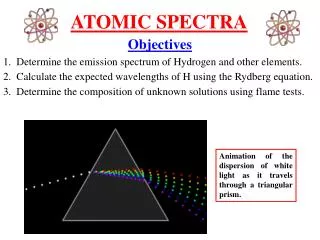
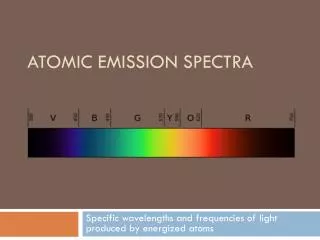
Atomic Emission Spectra. The Electromagnetic Spectrum. High frequency Short wavelength High energy. lower frequency longer wavelength lower energy. Emission of Light. When electrons are excited they can move to a higher energy level.

E N D
The Electromagnetic Spectrum High frequency Short wavelength High energy lower frequency longer wavelength lower energy
Emission of Light • When electrons are excited they can move to a higher energy level. • When they move back down they emit energy in the form of light • The color of the light emitted depends on the FREQUENCY • This light forms a LINE SPECTRUM
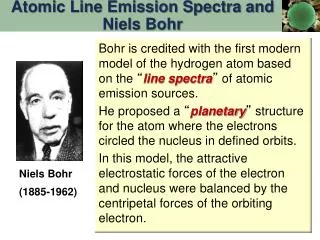
Line Spectra • Because electrons can only exist in certain energy levels, only certain transitions can occur. • e.g. an electron can move from the second energy level (n=2) to the first energy level (n=1). • Each transition emits light of a particular frequency. • Therefore a line spectrum is produced. • A continuous spectrum would suggest that electrons can exist anywhere around the nucleus
Which Frequencies can be observed? • From n=x to n=1: • These are the transitions that emit the most energy (highest frequency or shortest wavelength), therefore in u.v. range. • N=3 n=1emits a higher frequency than n=2 n=1 etc
Notes • Notice that at higher frequencies the lines get closer together (converge) • This indicates that the energy difference between levels becomes less as the level number increases. • In other words: the difference in energy between n=1 and n=2is less than the difference in energy between n=1 and n=3
The lower energy part of the spectrum • Represents lower energy transitions • E.g. an electron moving from n=4 to n=3 • These energy levels are closer so less energy is emitted. • Convergence is also observed here, e.g lines for n=6 n=3 will be extremely close to the line for n=7 n=3 • Each series will come to an end with the line for the transition from n = ∞
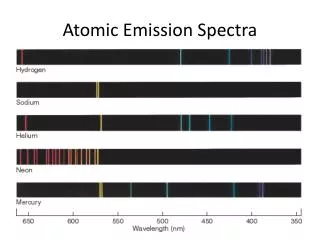
Some Atomic Emission Spectra • Hydrogen Mercury Argon Helium