Download
1 / 16
160 likes | 167 Views
The consumption of these coatings is heavily dependent on construction and remodelling/maintenance activities. Therefore, the main end uses for n-butanol include construction, industrial, automotive, chemical processing, food and pharmaceutical.

E N D
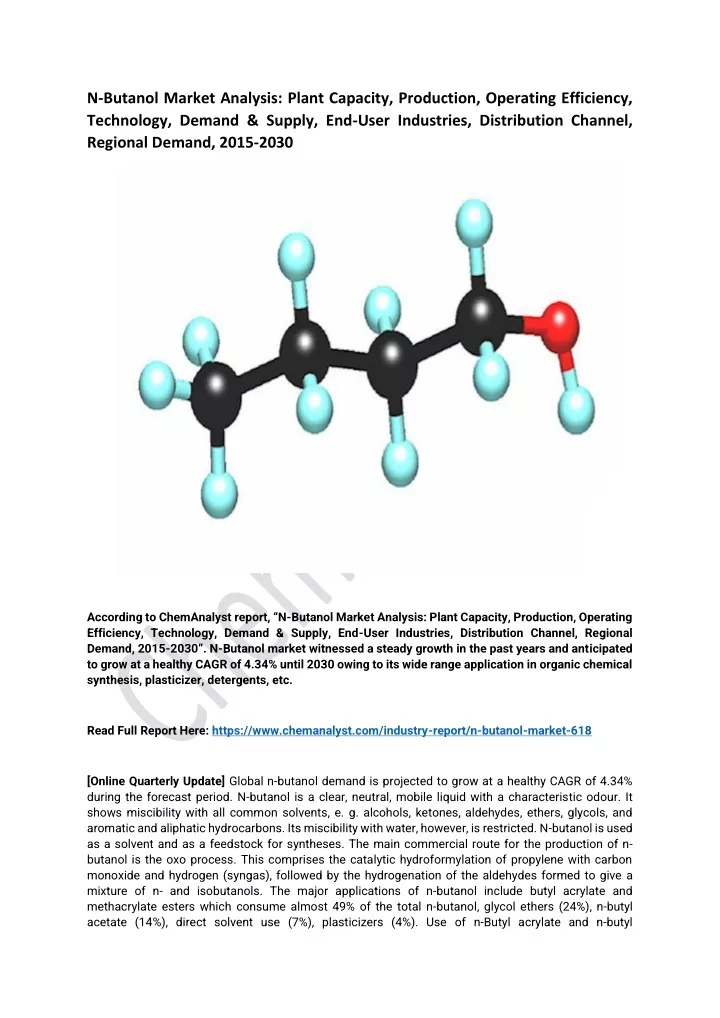
N-Butanol Market Analysis: Plant Capacity, Production, Operating Efficiency, Technology, Demand & Supply, End-User Industries, Distribution Channel, Regional Demand, 2015-2030 According to ChemAnalyst report, “N-Butanol Market Analysis: Plant Capacity, Production, Operating Efficiency, Technology, Demand & Supply, End-User Industries, Distribution Channel, Regional Demand, 2015-2030”. N-Butanol market witnessed a steady growth in the past years and anticipated to grow at a healthy CAGR of 4.34% until 2030 owing to its wide range application in organic chemical synthesis, plasticizer, detergents, etc. Read Full Report Here: https://www.chemanalyst.com/industry-report/n-butanol-market-618 [Online Quarterly Update] Global n-butanol demand is projected to grow at a healthy CAGR of 4.34% during the forecast period. N-butanol is a clear, neutral, mobile liquid with a characteristic odour. It shows miscibility with all common solvents, e. g. alcohols, ketones, aldehydes, ethers, glycols, and aromatic and aliphatic hydrocarbons. Its miscibility with water, however, is restricted. N-butanol is used as a solvent and as a feedstock for syntheses. The main commercial route for the production of n- butanol is the oxo process. This comprises the catalytic hydroformylation of propylene with carbon monoxide and hydrogen (syngas), followed by the hydrogenation of the aldehydes formed to give a mixture of n- and isobutanols. The major applications of n-butanol include butyl acrylate and methacrylate esters which consume almost 49% of the total n-butanol, glycol ethers (24%), n-butyl acetate (14%), direct solvent use (7%), plasticizers (4%). Use of n-Butyl acrylate and n-butyl
methacrylate comprise nearly half of n-butanol’s demand. The drivers for both of these are emulsified and solution polymers used in latex surface coatings, enamels and lacquers. The consumption of these coatings is heavily dependent on construction and remodelling/maintenance activities. Therefore, the main end uses for n-butanol include construction, industrial, automotive, chemical processing, food and pharmaceutical. Growing demand of surface coatings, enamels and lacquers from the construction sector is expected to drive the demand of n-butanol during the forecast period. Moreover, upcoming new technologies which are producing bio-based n-butanol for fuel purpose are expected to support further demand rise during the forecast period. However, the stringent environmental regulations regarding the volatile organic compounds (VOC) emissions related to n-butanol are expected to hinder the demand growth during the forecast period. Read Free Sample Report Online: https://www.chemanalyst.com/ChemAnalyst/RequestForm Owing to the impact of COVID-19, n-butanol demand has declined drastically due to nationwide lockdowns and subsequent disruptions in supply chains. Construction and infrastructure sectors were the most severely hit sectors during the pandemic which had an impact on paints, coatings and adhesives industry which have application of n-butanol as solvent. However overall good demand growth has been observed in China from the manufacturing sector due to continuation of production activities after the lockdowns. Objective of the Study: • To assess the demand-supply scenario of n-butanol which covers production, demand and supply of n-butanol market globally. • To analyse and forecast the market size of n-butanol. • To classify and forecast global n-butanol market based on technology, end-use and regional distribution. • To identify drivers and challenges for global n-butanol market. • To examine competitive developments such as expansions, new product launches, mergers & acquisitions, etc., in global n-butanol market. • To identify and analyse the profile of leading players involved in the manufacturing of n-butanol.
Regional Outlook: Region wise, Asia Pacific region holds the major share of global demand for n-butanol due to growing demand for commercial and residential construction. Key Players by Region along with Geography: ➢BASF ➢The DOW Chemical Company ➢Eastman ➢OQ Chemicals ➢Sasol ➢BASF Petronas ➢PetroChina ➢Mitsubishi Chemical Company ➢Sinopec ➢KH Neochem, and Others. To extract data for global n-butanol market, primary research surveys were conducted with n-butanol manufacturers, suppliers, distributors, wholesalers, and end users. While interviewing, the respondents were also inquired about their competitors. Through this technique, ChemAnalyst was able to include manufacturers that could not be identified due to the limitations of secondary research. Moreover, ChemAnalyst analyzed various end user segments and projected a positive outlook for Global n-butanol market over the coming years. ChemAnalyst calculated n-butanol demand globally by analyzing the historical data and demand forecast which was carried out considering imported n-butanol, prices, materials used for production of n-butanol. ChemAnalyst sourced these values from industry experts and company representatives and externally validated through analyzing historical sales data of respective manufacturers to arrive at the overall market size. Various secondary sources such as company websites, association reports, annual reports, etc., were also studied by ChemAnalyst. Key Target Audience: • • • • n-butanol manufacturers and other stakeholders Organizations, forums and alliances related to n-butanol distribution Government bodies such as regulating authorities and policy makers Market research organizations and consulting companies The study is useful in providing answers to several critical questions that are important for industry stakeholders such as n-butanol manufacturers, customers and policy makers. The study would also help them to target the growing segments over the coming years (next two to five years), thereby aiding the stakeholders in taking investment decisions and facilitating their expansion
Report Scope: In this report, global n-butanol market has been segmented into following categories, in addition to the industry trends which have also been detailed below: ATTRIBUTE DETAILS Historical Period 2015-202019 Base Year 2020 Estimated Year 2021 Forecast Period 2022-2030 Market, by End-Use • • • • • Construction Industrial Automotive Chemical Processing Food and Pharmaceutical Market, by Application • • • • • Butyl Acrylate and Methacrylate Esters Glycol Ethers N-Butyl Acetate Direct Solvent Use Plasticizers Sales Channel • • • • Direct Company Sale Direct Import Distributors & Traders Retailers Segmentation Market, by Region • • • • • North America APAC Europe MEA South America
Table of Contents: 1. Global N-butanol Market Outlook, 2015-2030 1.1. Capacity, By Volume 1.1.1. By Region 1.2. Production 1.2.1. By Region 1.3. Operating Efficiency 1.3.1. By Region 2. Global N-butanol Demand Outlook, 2015-2030, By Volume 2.1. By Application (Butyl Acrylate and Methacrylate Esters, Glycol Ethers, N-Butyl Acetate, Direct Solvent Use, Plasticizers) 2.2. By End Use (Construction, Industrial, Automotive, Chemical Processing, Food and Pharmaceutical) 2.3. By Region 2.4. By Company 3. North America N-butanol Market Outlook, 2015-2030 3.1. Capacity, By Volume 3.1.1. By Country 3.2. Production 3.2.1. By Country 3.3. Operating Efficiency 3.3.1. By Country 4. North America N-butanol Demand Outlook, 2015-2030, By Volume 4.1. By Application 4.2. By End Use 4.3. By Country 4.4. United States N-butanol Market Outlook, 2015-2030 4.4.1. Capacity, By Volume 4.4.1.1. By Company 4.4.1.2. By Location 4.4.2. Production 4.4.2.1. By Company 4.4.3. Operating Efficiency 4.4.3.1. By Company
4.4.4. United States N-butanol Demand-Supply Scenario, 2015-2030, By Volume 4.4.4.1. Demand 4.4.4.2. Supply 4.4.4.3. Gap 4.4.5. United States N-butanol Demand Outlook, 2015-2030, By Volume 4.4.5.1. By Application 4.4.5.2. By End Use 4.4.5.3. By Region 4.4.5.4. By Sales Channel 4.5. Mexico N-butanol Market Outlook, 2015-2030 4.5.1. Capacity, By Volume 4.5.1.1. By Company 4.5.1.2. By Location 4.5.2. Production 4.5.2.1. By Company 4.5.3. Operating Efficiency 4.5.3.1. By Company 4.5.4. Mexico N-butanol Demand-Supply Scenario, 2015-2030, By Volume 4.5.4.1. Demand 4.5.4.2. Supply 4.5.4.3. Gap 4.5.5. Mexico N-butanol Demand Outlook, 2015-2030, By Volume 4.5.5.1. By Application 4.5.5.2. By End Use 4.5.5.3. By Region 4.5.5.4. By Sales Channel 4.6. Canada N-butanol Market Outlook, 2015-2030 4.6.1. Capacity, By Volume 4.6.1.1. By Company 4.6.1.2. By Location 4.6.2. Production 4.6.2.1. By Company 4.6.3. Operating Efficiency
4.6.3.1. By Company 4.6.4. Canada N-butanol Demand-Supply Scenario, 2015-2030, By Volume 4.6.4.1. Demand 4.6.4.2. Supply 4.6.4.3. Gap 4.6.5. Canada N-butanol Demand Outlook, 2015-2030, By Volume 4.6.5.1. By Application 4.6.5.2. By End Use 4.6.5.3. By Region 4.6.5.4. By Sales Channel 5. Asia Pacific N-butanol Market Outlook, 2015-2030 5.1. Capacity, By Volume 5.1.1. By Country 5.2. Production 5.2.1. By Country 5.3. Operating Efficiency 5.3.1. By Country 6. Asia Pacific N-butanol Demand Outlook, 2015-2030, By Volume 6.1. By Application 6.2. By End Use 6.3. By Country 6.4. China N-butanol Market Outlook, 2015-2030 6.4.1. Capacity, By Volume 6.4.1.1. By Company 6.4.1.2. By Location 6.4.2. Production 6.4.2.1. By Company 6.4.3. Operating Efficiency 6.4.3.1. By Company 6.4.4. China N-butanol Demand-Supply Scenario, 2015-2030, By Volume 6.4.4.1. Demand 6.4.4.2. Supply 6.4.4.3. Gap
6.4.5. China N-butanol Demand Outlook, 2015-2030, By Volume 6.4.5.1. By Application 6.4.5.2. By End Use 6.4.5.3. By Region 6.4.5.4. By Sales Channel 6.5. India N-butanol Market Outlook, 2015-2030 6.5.1. Capacity, By Volume 6.5.1.1. By Company 6.5.1.2. By Location 6.5.2. Production 6.5.2.1. By Company 6.5.3. Operating Efficiency 6.5.3.1. By Company 6.5.4. India N-butanol Demand-Supply Scenario, 2015-2030, By Volume 6.5.4.1. Demand 6.5.4.2. Supply 6.5.4.3. Gap 6.5.5. India N-butanol Demand Outlook, 2015-2030, By Volume 6.5.5.1. By Application 6.5.5.2. By End Use 6.5.5.3. By Region 6.5.5.4. By Sales Channel 6.6. Japan N-butanol Market Outlook, 2015-2030 6.6.1. Capacity, By Volume 6.6.1.1. By Company 6.6.1.2. By Location 6.6.2. Production 6.6.2.1. By Company 6.6.3. Operating Efficiency 6.6.3.1. By Company 6.6.4. Japan N-butanol Demand-Supply Scenario, 2015-2030, By Volume 6.6.4.1. Demand 6.6.4.2. Supply
6.6.4.3. Gap 6.6.5. Japan N-butanol Demand Outlook, 2015-2030, By Volume 6.6.5.1. By Application 6.6.5.2. By End Use 6.6.5.3. By Region 6.6.5.4. By Sales Channel 6.7. South Korea N-butanol Market Outlook, 2015-2030 6.7.1. Capacity, By Volume 6.7.1.1. By Company 6.7.1.2. By Location 6.7.2. Production 6.7.2.1. By Company 6.7.3. Operating Efficiency 6.7.3.1. By Company 6.7.4. South Korea N-butanol Demand-Supply Scenario, 2015-2030, By Volume 6.7.4.1. Demand 6.7.4.2. Supply 6.7.4.3. Gap 6.7.5. South Korea N-butanol Demand Outlook, 2015-2030, By Volume 6.7.5.1. By Application 6.7.5.2. By End Use 6.7.5.3. By Region 6.7.5.4. By Sales Channel 6.8. Taiwan N-butanol Market Outlook, 2015-2030 6.8.1. Capacity, By Volume 6.8.1.1. By Company 6.8.1.2. By Location 6.8.2. Production 6.8.2.1. By Company 6.8.3. Operating Efficiency 6.8.3.1. By Company 6.8.4. Taiwan N-butanol Demand-Supply Scenario, 2015-2030, By Volume 6.8.4.1. Demand
6.8.4.2. Supply 6.8.4.3. Gap 6.8.5. Taiwan N-butanol Demand Outlook, 2015-2030, By Volume 6.8.5.1. By Application 6.8.5.2. By End Use 6.8.5.3. By Sales Channel 7. Europe N-butanol Market Outlook, 2015-2030 7.1. Capacity, By Volume 7.1.1. By Country 7.2. Production 7.2.1. By Country 7.3. Operating Efficiency 7.3.1. By Country 8. Europe N-butanol Demand Outlook, 2015-2030, By Volume 8.1. By Application 8.2. By End Use 8.3. By Sales Channel (Direct/Institutional Sales, Retail Sales, Other Channel Sales) 8.4. By Country 8.5. Germany N-butanol Market Outlook, 2015-2030 8.5.1. Capacity, By Volume 8.5.1.1. By Company 8.5.1.2. By Location 8.5.2. Production 8.5.2.1. By Company 8.5.3. Operating Efficiency 8.5.3.1. By Company 8.5.4. Germany N-butanol Demand-Supply Scenario, 2015-2030, By Volume 8.5.4.1. Demand 8.5.4.2. Supply 8.5.4.3. Gap 8.5.5. Germany N-butanol Demand Outlook, 2015-2030, By Volume 8.5.5.1. By Application 8.5.5.2. By End Use
8.5.5.3. By Region 8.5.5.4. By Sales Channel 8.5.6. Belgium N-butanol Market Outlook, 2015-2030 8.5.6.1. Capacity, By Volume 8.5.6.1.1. By Company 8.5.6.1.2. By Location 8.5.6.2. Production 8.5.6.2.1. By Company 8.5.6.3. Operating Efficiency 8.5.6.3.1. By Company 8.5.7. Belgium N-butanol Demand-Supply Scenario, 2015-2030, By Volume 8.5.7.1. Demand 8.5.7.2. Supply 8.5.7.3. Gap 8.5.8. Belgium N-butanol Demand Outlook, 2015-2030, By Volume 8.5.8.1. By Application 8.5.8.2. By End Use 8.5.8.3. By Sales Channel 8.5.8.4. By Region 8.6. France N-butanol Market Outlook, 2015-2030 8.6.1. Capacity, By Volume 8.6.1.1. By Company 8.6.1.2. By Location 8.6.2. Production 8.6.2.1. By Company 8.6.3. Operating Efficiency 8.6.3.1. By Company 8.6.4. France N-butanol Demand-Supply Scenario, 2015-2030, By Volume 8.6.4.1. Demand 8.6.4.2. Supply 8.6.4.3. Gap 8.6.5. France N-butanol Demand Outlook, 2015-2030, By Volume 8.6.5.1. By Application
8.6.5.2. By End Use 8.6.5.3. By Sales Channel 8.6.5.4. By Region 8.7. United Kingdom N-butanol Market Outlook, 2015-2030 8.7.1. Capacity, By Volume 8.7.1.1. By Company 8.7.1.2. By Location 8.7.2. Production 8.7.2.1. By Company 8.7.3. Operating Efficiency 8.7.3.1. By Company 8.7.4. United Kingdom N-butanol Demand-Supply Scenario, 2015-2030, By Volume 8.7.4.1. Demand 8.7.4.2. Supply 8.7.4.3. Gap 8.7.5. United Kingdom N-butanol Demand Outlook, 2015-2030, By Volume 8.7.5.1. By Application 8.7.5.2. By End Use 8.7.5.3. By Sales Channel 8.7.5.4. By Region 8.8. Spain N-butanol Market Outlook, 2015-2030 8.8.1. Capacity, By Volume 8.8.1.1. By Company 8.8.1.2. By Location 8.8.2. Production 8.8.2.1. By Company 8.8.3. Operating Efficiency 8.8.3.1. By Company 8.8.4. Spain N-butanol Demand-Supply Scenario, 2015-2030, By Volume 8.8.4.1. Demand 8.8.4.2. Supply 8.8.4.3. Gap 8.8.5. Spain N-butanol Demand Outlook, 2015-2030, By Volume
8.8.5.1. By Application 8.8.5.2. By End Use 8.8.5.3. By Sales Channel 8.8.5.4. By Region 8.9. Italy N-butanol Market Outlook, 2015-2030 8.9.1. Capacity, By Volume 8.9.1.1. By Company 8.9.1.2. By Location 8.9.2. Production 8.9.2.1. By Company 8.9.3. Operating Efficiency 8.9.3.1. By Company 8.9.4. Italy N-butanol Demand-Supply Scenario, 2015-2030, By Volume 8.9.4.1. Demand 8.9.4.2. Supply 8.9.4.3. Gap 8.9.5. Italy N-butanol Demand Outlook, 2015-2030, By Volume 8.9.5.1. By Application 8.9.5.2. By End Use 8.9.5.3. By Sales Channel 8.9.5.4. By Region 9. MEA N-butanol Market Outlook, 2015-2030 9.1. Capacity, By Volume 9.1.1. By Country 9.2. Production 9.2.1. By Country 9.3. Operating Efficiency 9.3.1. By Country 10. MEA N-butanol Demand Outlook, 2015-2030, By Volume 10.1. By Application 10.2. By End Use 10.3. By Sales Channel (Direct/Institutional Sales, Retail Sales, Other Channel Sales) 10.4. By Country
10.5. Saudi Arabia N-butanol Market Outlook, 2015-2030 10.5.1. Capacity, By Volume 10.5.1.1. By Company 10.5.1.2. By Location 10.5.2. Production 10.5.2.1. By Company 10.5.3. Operating Efficiency 10.5.3.1. By Company 10.5.4. Saudi Arabia N-butanol Demand-Supply Scenario, 2015-2030, By Volume 10.5.4.1. Demand 10.5.4.2. Supply 10.5.4.3. Gap 10.5.5. Saudi Arabia N-butanol Demand Outlook, 2015-2030, By Volume 10.5.5.1. By Application 10.5.5.2. By End Use 10.5.5.3. By Sales Channel 10.5.5.4. By Region 10.6. South Africa N-butanol Market Outlook, 2015-2030 10.6.1. Capacity, By Volume 10.6.1.1. By Company 10.6.1.2. By Location 10.6.2. Production 10.6.2.1. By Company 10.6.3. Operating Efficiency 10.6.3.1. By Company 10.6.4. South Africa N-butanol Demand-Supply Scenario, 2015-2030, By Volume 10.6.4.1. Demand 10.6.4.2. Supply 10.6.4.3. Gap 10.6.5. South Africa N-butanol Demand Outlook, 2015-2030, By Volume 10.6.5.1. By Application 10.6.5.2. By End Use 10.6.5.3. By Sales Channel
10.6.5.4. By Region 11. South America N-butanol Market Outlook, 2015-2030 11.1. Capacity, By Volume 11.1.1. By Country 11.2. Production 11.2.1. By Country 11.3. Operating Efficiency 11.3.1. By Country 12. South America N-butanol Demand Outlook, 2015-2030, By Volume 12.1. By Application 12.2. By End Use 12.3. By Sales Channel (Direct/Institutional Sales, Retail Sales, Other Channel Sales) 12.4. By Country 12.5. Brazil N-butanol Market Outlook, 2015-2030 12.5.1. Capacity, By Volume 12.5.1.1. By Company 12.5.1.2. By Location 12.5.2. Production 12.5.2.1. By Company 12.5.3. Operating Efficiency 12.5.3.1. By Company 12.5.4. Brazil N-butanol Demand-Supply Scenario, 2015-2030, By Volume 12.5.4.1. Demand 12.5.4.2. Supply 12.5.4.3. Gap 12.5.5. Brazil N-butanol Demand Outlook, 2015-2030, By Volume 12.5.5.1. By Application 12.5.5.2. By End Use 12.5.5.3. By Sales Channel 12.5.5.4. By Region
About Us: ChemAnalyst is a leading provider of chemical commodity prices in more than 12 countries since from last 4 Years. The company has emerged as a preferred pricing supplier amongst Procurement Managers and Strategy Professionals globally who wants to track near real time prices of chemicals on its interactive dashboard. Unlike most of its competitors such as ICIS, IHS & S&P Platts the company doesn’t believe in delivering prices in PDF reports. The company has developed proprietary algorithm based online subscription platform in which users can track years of historical prices of more than 250 chemical commodities. In addition, since it’s all online, the users cannot just compare prices across multiple countries but also with other commodities and play with the data by generating multiple graphs to find out amazing insights. The users get access to grade wise CIF, CFR & Ex Works prices at multiple ports in each country. ChemAnalyst also provides market analysis for more than 1000+ chemical commodities such as Production, Demand, Supply, Plant Operating Rate, Imports, Exports, Suppliers, Customers and much more. The company has created online interactive dashboard in which customers can access all this data instantly with a click of a button. The users will not only be able to analyse historical data for past years but will also get to analyse short term and long-term forecasts for coming years. With the access to local field teams, the company can provide high quality reliable market analysis data for more than 20 countries. ChemAnalyst is a one stop solution for all the data related needs. We at ChemAnalyst are committed to assist customers worldwide with their data and insights needs using our comprehensive online platform. Contact Us: B-44, Sector -57, Noida, National Capital Region, UP, India 201301 Tel: +91-120-4523900 Email-id: sales@chemanalyst.com