Download
1 / 20
200 likes | 207 Views
Whereas other derivatives of Propylene find application in various industries including Cosmetics and Personal Care, Food & Beverage, Pharmaceuticals, Building & Construction, Automotive, and Others (textile, paper and pulp, electronics, consumer goods, chemicals). Hence, depending on the utility of Propylene and its derivatives, the major end use industries are Automotive, Packaging, Construction, Textiles and Others.

E N D
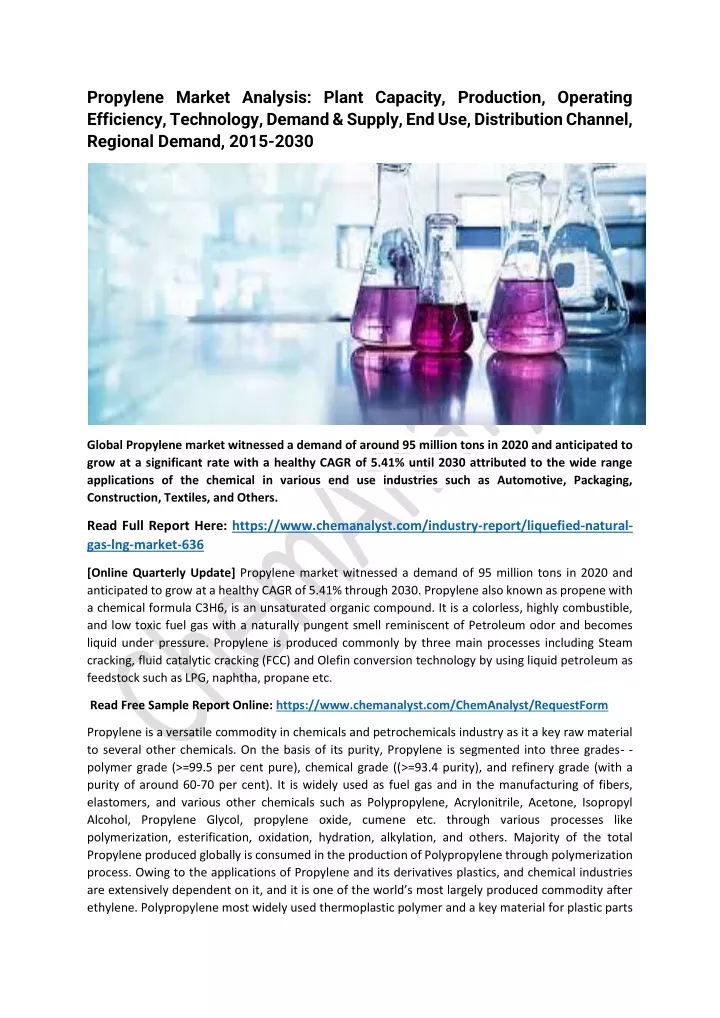
Propylene Market Analysis: Plant Capacity, Production, Operating Efficiency, Technology, Demand & Supply, End Use, Distribution Channel, Regional Demand, 2015-2030 Global Propylene market witnessed a demand of around 95 million tons in 2020 and anticipated to grow at a significant rate with a healthy CAGR of 5.41% until 2030 attributed to the wide range applications of the chemical in various end use industries such as Automotive, Packaging, Construction, Textiles, and Others. Read Full Report Here: https://www.chemanalyst.com/industry-report/liquefied-natural- gas-lng-market-636 [Online Quarterly Update] Propylene market witnessed a demand of 95 million tons in 2020 and anticipated to grow at a healthy CAGR of 5.41% through 2030. Propylene also known as propene with a chemical formula C3H6, is an unsaturated organic compound. It is a colorless, highly combustible, and low toxic fuel gas with a naturally pungent smell reminiscent of Petroleum odor and becomes liquid under pressure. Propylene is produced commonly by three main processes including Steam cracking, fluid catalytic cracking (FCC) and Olefin conversion technology by using liquid petroleum as feedstock such as LPG, naphtha, propane etc. Read Free Sample Report Online: https://www.chemanalyst.com/ChemAnalyst/RequestForm Propylene is a versatile commodity in chemicals and petrochemicals industry as it a key raw material to several other chemicals. On the basis of its purity, Propylene is segmented into three grades- - polymer grade (>=99.5 per cent pure), chemical grade ((>=93.4 purity), and refinery grade (with a purity of around 60-70 per cent). It is widely used as fuel gas and in the manufacturing of fibers, elastomers, and various other chemicals such as Polypropylene, Acrylonitrile, Acetone, Isopropyl Alcohol, Propylene Glycol, propylene oxide, cumene etc. through various processes like polymerization, esterification, oxidation, hydration, alkylation, and others. Majority of the total Propylene produced globally is consumed in the production of Polypropylene through polymerization process. Owing to the applications of Propylene and its derivatives plastics, and chemical industries are extensively dependent on it, and it is one of the world’s most largely produced commodity after ethylene. Polypropylene most widely used thermoplastic polymer and a key material for plastic parts
and used in several industries including packaging, electronics and electrical, automotive, textile, living hinges and others. Whereas other derivatives of Propylene find application in various industries including Cosmetics and Personal Care, Food & Beverage, Pharmaceuticals, Building & Construction, Automotive, and Others (textile, paper and pulp, electronics, consumer goods, chemicals). Hence, depending on the utility of Propylene and its derivatives, the major end use industries are Automotive, Packaging, Construction, Textiles and Others. Hence, the growth in these sectors would augment the demand for Propylene in the forecast period. However, the factors like health and environmental hazards related to Propylene along with strict safety guidelines related to its production and transportation are anticipated to be the major restraints in market growth of Propylene. In the first half of 2020, the outbreak of Covid-19 pandemic impacted several industries due to the imposition of nationwide lockdowns by the global economies that resulted into the hinderance in industrial operations and trade. Despite one of the widely used chemical, a slum in the demand for Propylene was observed, as its end use industries such as Automotive, Textile and Construction sector were drastically affected amid first wave of Covid-19. Although demand for Propylene has been surged from Packaging industry due to the acceleration in e commerce during pandemics. Moreover, in the latter half of 2020, after the relaxations in lockdown there was a speedy recovery in the Automobile as well as Construction sectors which consequently improved the demand for Propylene in market. It is anticipated that the market for Propylene is likely to propel at a promising rate in the forecast period owing to its wide range applications. Objective of the Study: •The primary objective of the study was to evaluate and forecast the Propylene capacity, production, demand, inventory, and demand– supply gap globally. •To categorize Propylene demand based on End Use, Grades, region, and distribution channel •To identify major customers of Propylene globally. •To evaluate and forecast Propylene pricing globally. •To identify and profile major companies operating globally Propylene Market. •To identify major news, deals and expansion plans globally Propylene Market.
Regional Outlook: Region wise, Asia-Pacific dominates the market for Propylene globally and is projected to grow significantly over the forecast period owing to the booming Automobile, Construction, Packaging and Textile sectors in the region. Additionally, China is the leading producer of textile, plastics, electronics among others therefore, expected to lead the propylene industry over the forthcoming years. In Asia Pacific region, China, India, Japan, and South Korea are among the world’s leading consumers of Propylene and are likely to bolster the market growth of Propylene in Asia Pacific over the forecast period. Key Players by Region along with Geography: ➢LyondellBasell Industries N.V. ➢The Dow chemical Company ➢ SABIC ➢BASF SE ➢Sinopec Corp. ➢BP plc. ➢ExxonMobil Corporation ➢Shell Plc. ➢Total S.A. ➢Huntsman Corporation ➢Valero Energy Corp. ➢China Petroleum & Chemical Corporation ➢IRPC plc. ➢Reliance Industries Limited among others. To extract data for Propylene Market, primary research surveys were conducted with Propylene manufacturers, suppliers, distributors, wholesalers and end users. While interviewing, the respondents were also inquired about their competitors. Through this technique, ChemAnalyst was able to include manufacturers that could not be identified due to the limitations of secondary research. Moreover, ChemAnalyst analyzed various end user segments and projected a positive outlook for Global Propylene Market over the coming years. ChemAnalyst calculated Propylene Demand globally by analyzing the historical data and demand forecast which was carried out considering the Application industries growth. ChemAnalyst sourced these values from industry experts and company representatives and externally validated through analyzing historical sales data of respective manufacturers to arrive at the overall market size. Various secondary sources such as company websites, association reports, annual reports, etc., were also studied by ChemAnalyst. Key Target Audience • Propylene manufacturers and other stakeholders • Organizations, forums and alliances related to Propylene distribution • Government bodies such as regulating authorities and policy makers • Market research organizations and consulting companies
The study is useful in providing answers to several critical questions that are important for industry stakeholders, such as Propylene manufacturers, distributors, and policymakers. The report also provides useful insights about which market segments should be targeted over the coming years to strategize investments and capitalize on growth opportunities. Report Scope: In this report, the Global Propylene Market has been segmented into following categories, in addition to the industry trends which have also been detailed below: Attribute Details Market size volume in 2020 95 million Tonnes Growth Rate CAGR of 5.41% from 2021 to 2030 Base year for estimation 2020 Historic Data 2015 – 2019 Forecast period 2022 – 2030 Quantitative units Revenue in USD million/billion and CAGR from 2021 to 2030 Report coverage Revenue forecast, demand & supply, competitive analysis, competitive landscape, growth factors, and trends Segments covered • Grade (Polymer Grade (>=99.5%), Chemical Grade (>=93.4%), Refinery Grade (60 - 70%)) End-Use (Packaging, Construction, Automotive, Textile and Others) Sales Channel (Direct/Institutional Sales, Other Channel Sales) • • Regional scope North America; Europe; Asia Pacific; South America; Middle East & Africa Country scope United States; Mexico; Canada; China; India; Japan; South Korea; Taiwan; Singapore; Germany; Belgium; France; United Kingdom; Spain; Italy; Sweden; Austria; Saudi Arabia; Iran; South Africa; Brazil; Argentina Key companies profiled LyondellBasell Industries N.V., The Dow chemical Company, SABIC, BASF SE, Sinopec Corp., BP plc., ExxonMobil Corporation, Shell Plc., Total S.A., Huntsman Corporation, Valero Energy Corp., China Petroleum & Chemical Corporation, IRPC plc., Reliance Industries Limited among others. Customization scope Free report customization with purchase. Addition or alteration to country, regional & segment scope. Pricing and purchase options Avail customized purchase options to meet your exact research needs. Explore purchase options
Table of Contents: 1. Global Polypropylene Glycol Market Outlook, 2015-2030 1.1. Capacity, By Volume 1.1.1. By Company 1.2. Production, By Volume 1.2.1. By Company 1.3. Operating Efficiency 1.3.1. By Company 2. Global Polypropylene Glycol Demand Outlook, 2015-2030, By Volume 2.1. By End Use 2.2. By Grade 2.3. By Region 2.4. By Company 2.5. By Sales channel 3. North America Polypropylene Glycol Market Outlook, 2015-2030 3.1. Capacity, By Volume 3.1.1. By Country 3.2. Production 3.2.1. By Country 3.3. Operating Efficiency 3.3.1. By Country 4. North America Polypropylene Glycol Demand Outlook, 2015-2030, By Volume 4.1. By End Use 4.2. By Grade 4.3. By Country 4.4. United States Polypropylene Glycol Market Outlook, 2015-2030 4.4.1. Capacity, By Volume 4.4.1.1. By Company 4.4.1.2. By Location 4.4.2. Production 4.4.2.1. By Company
4.4.3. Operating Efficiency 4.4.3.1. By Company 4.4.4. United States Polypropylene Glycol Demand-Supply Scenario, 2015-2030, By Volume 4.4.4.1. Demand 4.4.4.2. Supply 4.4.4.3. Gap 4.4.5. United States Polypropylene Glycol Demand Outlook, 2015-2030, By Volume 4.4.5.1. By End Use 4.4.5.2. By Grade 4.4.5.3. By Company Share (At least top 3 companies’ market share) 4.4.5.4. By Region 4.4.5.5. By Sales Channel 4.5. Mexico Polypropylene Glycol Market Outlook, 2015-2030 4.5.1. Capacity, By Volume 4.5.1.1. By Company 4.5.1.2. By Location 4.5.2. Production 4.5.2.1. By Company 4.5.3. Operating Efficiency 4.5.3.1. By Company 4.5.4. Mexico Polypropylene Glycol Demand-Supply Scenario, 2015-2030, By Volume 4.5.4.1. Demand 4.5.4.2. Supply 4.5.4.3. Gap 4.5.5. Mexico Polypropylene Glycol Demand Outlook, 2015-2030, By Volume 4.5.5.1. By End Use 4.5.5.2. By Grade 4.5.5.3. By Company Share (At least top 3 companies’ market share) 4.5.5.4. By Region 4.5.5.5. By Sales Channel 4.6. Canada Polypropylene Glycol Market Outlook, 2015-2030
4.6.1. Capacity, By Volume 4.6.1.1. By Company 4.6.1.2. By Location 4.6.2. Production 4.6.2.1. By Company 4.6.3. Operating Efficiency 4.6.3.1. By Company 4.6.4. Canada Polypropylene Glycol Demand-Supply Scenario, 2015-2030, By Volume 4.6.4.1. Demand 4.6.4.2. Supply 4.6.4.3. Gap 4.6.5. Canada Polypropylene Glycol Demand Outlook, 2015-2030, By Volume 4.6.5.1. By End Use 4.6.5.2. By Grade 4.6.5.3. By Company Share (At least top 3 companies’ market share) 4.6.5.4. By Region 4.6.5.5. By Sales Channel 5. Asia Pacific Polypropylene Glycol Market Outlook, 2015-2030 5.1. Capacity, By Volume 5.1.1. By Country 5.2. Production 5.2.1. By Country 5.3. Operating Efficiency 5.3.1. By Country 6. Asia Pacific Polypropylene Glycol Demand Outlook, 2015-2030, By Volume 6.1. By End Use 6.2. By Grade 6.3. By Country 6.4. China Polypropylene Glycol Market Outlook, 2015-2030 6.4.1. Capacity, By Volume 6.4.1.1. By Company
6.4.1.2. By Location 6.4.2. Production 6.4.2.1. By Company 6.4.3. Operating Efficiency 6.4.3.1. By Company 6.4.4. China Polypropylene Glycol Demand-Supply Scenario, 2015-2030, By Volume 6.4.4.1. Demand 6.4.4.2. Supply 6.4.4.3. Gap 6.4.5. China Polypropylene Glycol Demand Outlook, 2015-2030, By Volume 6.4.5.1. By End Use 6.4.5.2. By Grade 6.4.5.3. By Company Share (At least top 3 companies’ market share) 6.4.5.4. By Region 6.4.5.5. By Sales Channel 6.5. India Polypropylene Glycol Market Outlook, 2015-2030 6.5.1. Capacity, By Volume 6.5.1.1. By Company 6.5.1.2. By Location 6.5.2. Production 6.5.2.1. By Company 6.5.3. Operating Efficiency 6.5.3.1. By Company 6.5.4. India Polypropylene Glycol Demand-Supply Scenario, 2015-2030, By Volume 6.5.4.1. Demand 6.5.4.2. Supply 6.5.4.3. Gap 6.5.5. India Polypropylene Glycol Demand Outlook, 2015-2030, By Volume 6.5.5.1. By End Use 6.5.5.2. By Grade 6.5.5.3. By Company Share (At least top 3 companies’ market share)
6.5.5.4. By Region 6.5.5.5. By Sales Channel 6.6. Japan Polypropylene Glycol Market Outlook, 2015-2030 6.6.1. Capacity, By Volume 6.6.1.1. By Company 6.6.1.2. By Location 6.6.2. Production 6.6.2.1. By Company 6.6.3. Operating Efficiency 6.6.3.1. By Company 6.6.4. Japan Polypropylene Glycol Demand-Supply Scenario, 2015-2030, By Volume 6.6.4.1. Demand 6.6.4.2. Supply 6.6.4.3. Gap 6.6.5. Japan Polypropylene Glycol Demand Outlook, 2015-2030, By Volume 6.6.5.1. By End Use 6.6.5.2. By Grade 6.6.5.3. By Company Share (At least top 3 companies’ market share) 6.6.5.4. By Region 6.6.5.5. By Sales Channel 6.7. South Korea Polypropylene Glycol Market Outlook, 2015-2030 6.7.1. Capacity, By Volume 6.7.1.1. By Company 6.7.1.2. By Location 6.7.2. Production 6.7.2.1. By Company 6.7.3. Operating Efficiency 6.7.3.1. By Company 6.7.4. South Korea Polypropylene Glycol Demand-Supply Scenario, 2015-2030, By Volume 6.7.4.1. Demand 6.7.4.2. Supply
6.7.4.3. Gap 6.7.5. South Korea Polypropylene Glycol Demand Outlook, 2015-2030, By Volume 6.7.5.1. By End Use 6.7.5.2. By Grade 6.7.5.3. By Company Share (At least top 3 companies’ market share) 6.7.5.4. By Region 6.7.5.5. By Sales Channel 6.8. Taiwan Polypropylene Glycol Market Outlook, 2015-2030 6.8.1. Capacity, By Volume 6.8.1.1. By Company 6.8.1.2. By Location 6.8.2. Production 6.8.2.1. By Company 6.8.3. Operating Efficiency 6.8.3.1. By Company 6.8.4. Taiwan Polypropylene Glycol Demand-Supply Scenario, 2015-2030, By Volume 6.8.4.1. Demand 6.8.4.2. Supply 6.8.4.3. Gap 6.8.5. Taiwan Polypropylene Glycol Demand Outlook, 2015-2030, By Volume 6.8.5.1. By End Use 6.8.5.2. By Grade 6.8.5.3. By Region 6.8.5.4. By Sales Channel 6.8.5.5. By Company Share (At least top 3 companies’ market share) 6.9. Singapore Polypropylene Glycol Market Outlook, 2015-2030 6.9.1. Capacity, By Volume 6.9.1.1. By Company 6.9.1.2. By Location 6.9.2. Production 6.9.2.1. By Company
6.9.3. Operating Efficiency 6.9.3.1. By Company 6.9.4. Singapore Polypropylene Glycol Demand-Supply Scenario, 2015-2030, By Volume 6.9.4.1. Demand 6.9.4.2. Supply 6.9.4.3. Gap 6.9.5. Singapore Polypropylene Glycol Demand Outlook, 2015-2030, By Volume 6.9.5.1. By End Use 6.9.5.2. By Grade 6.9.5.3. By Region 6.9.5.4. By Sales Channel 6.9.5.5. By Company Share (At least top 3 companies’ market share) 7. Europe Polypropylene Glycol Market Outlook, 2015-2030 7.1. Capacity, By Volume 7.1.1. By Country 7.2. Production 7.2.1. By Country 7.3. Operating Efficiency 7.3.1. By Country 8. Europe Polypropylene Glycol Demand Outlook, 2015-2030, By Volume 8.1. By End Use 8.2. By Grade 8.3. By Sales Channel (Direct/Institutional Sales, Retail Sales, Other Channel Sales) 8.4. By Country 8.5. Germany Polypropylene Glycol Market Outlook, 2015-2030 8.5.1. Capacity, By Volume 8.5.1.1. By Company 8.5.1.2. By Location 8.5.2. Production 8.5.2.1. By Company 8.5.3. Operating Efficiency
8.5.3.1. By Company 8.5.4. Germany Polypropylene Glycol Demand-Supply Scenario, 2015-2030, By Volume 8.5.4.1. Demand 8.5.4.2. Supply 8.5.4.3. Gap 8.5.5. Germany Polypropylene Glycol Demand Outlook, 2015-2030, By Volume 8.5.5.1. By End Use 8.5.5.2. By Grade 8.5.5.3. By Company Share (At least top 3 companies’ market share) 8.5.5.4. By Region 8.5.5.5. By Sales Channel 8.5.6. Belgium Polypropylene Glycol Market Outlook, 2015-2030 8.5.6.1. Capacity, By Volume 8.5.6.1.1. By Company 8.5.6.1.2. By Location 8.5.6.2. Production 8.5.6.2.1. By Company 8.5.6.3. Operating Efficiency 8.5.6.3.1. By Company 8.5.7. Belgium Polypropylene Glycol Demand-Supply Scenario, 2015-2030, By Volume 8.5.7.1. Demand 8.5.7.2. Supply 8.5.7.3. Gap 8.5.8. Belgium Polypropylene Glycol Demand Outlook, 2015-2030, By Volume 8.5.8.1. By End Use 8.5.8.2. By Grade 8.5.8.3. By Sales Channel 8.5.8.4. By Company Share (At least top 3 companies’ market share) 8.5.8.5. By Region 8.6. France Polypropylene Glycol Market Outlook, 2015-2030 8.6.1. Capacity, By Volume
8.6.1.1. By Company 8.6.1.2. By Location 8.6.2. Production 8.6.2.1. By Company 8.6.3. Operating Efficiency 8.6.3.1. By Company 8.6.4. France Polypropylene Glycol Demand-Supply Scenario, 2015-2030, By Volume 8.6.4.1. Demand 8.6.4.2. Supply 8.6.4.3. Gap 8.6.5. France Polypropylene Glycol Demand Outlook, 2015-2030, By Volume 8.6.5.1. By End Use 8.6.5.2. By Grade 8.6.5.3. By Sales Channel 8.6.5.4. By Company Share (At least top 3 companies’ market share) 8.6.5.5. By Region 8.7. United Kingdom Polypropylene Glycol Market Outlook, 2015-2030 8.7.1. Capacity, By Volume 8.7.1.1. By Company 8.7.1.2. By Location 8.7.2. Production 8.7.2.1. By Company 8.7.3. Operating Efficiency 8.7.3.1. By Company 8.7.4. United Kingdom Polypropylene Glycol Demand-Supply Scenario, 2015-2030, By Volume 8.7.4.1. Demand 8.7.4.2. Supply 8.7.4.3. Gap 8.7.5. United Kingdom Polypropylene Glycol Demand Outlook, 2015-2030, By Volume 8.7.5.1. By End Use 8.7.5.2. By Grade
8.7.5.3. By Sales Channel 8.7.5.4. By Company Share (At least top 3 companies’ market share) 8.7.5.5. By Region 8.8. Spain Polypropylene Glycol Market Outlook, 2015-2030 8.8.1. Capacity, By Volume 8.8.1.1. By Company 8.8.1.2. By Location 8.8.2. Production 8.8.2.1. By Company 8.8.3. Operating Efficiency 8.8.3.1. By Company 8.8.4. Spain Polypropylene Glycol Demand-Supply Scenario, 2015-2030, By Volume 8.8.4.1. Demand 8.8.4.2. Supply 8.8.4.3. Gap 8.8.5. Spain Polypropylene Glycol Demand Outlook, 2015-2030, By Volume 8.8.5.1. By End Use 8.8.5.2. By Grade 8.8.5.3. By Sales Channel 8.8.5.4. By Company Share (At least top 3 companies’ market share) 8.8.5.5. By Region 8.9. Italy Polypropylene Glycol Market Outlook, 2015-2030 8.9.1. Capacity, By Volume 8.9.1.1. By Company 8.9.1.2. By Location 8.9.2. Production 8.9.2.1. By Company 8.9.3. Operating Efficiency 8.9.3.1. By Company 8.9.4. Italy Polypropylene Glycol Demand-Supply Scenario, 2015-2030, By Volume 8.9.4.1. Demand
8.9.4.2. Supply 8.9.4.3. Gap 8.9.5. Italy Polypropylene Glycol Demand Outlook, 2015-2030, By Volume 8.9.5.1. By End Use 8.9.5.2. By Grade 8.9.5.3. By Sales Channel 8.9.5.4. By Company Share (At least top 3 companies’ market share) 8.9.5.5. By Region 8.10. Sweden Polypropylene Glycol Market Outlook, 2015-2030 8.10.1. Capacity, By Volume 8.10.1.1. By Company 8.10.1.2. By Location 8.10.2. Production 8.10.2.1. By Company 8.10.3. Operating Efficiency 8.10.3.1. By Company 8.10.4. Sweden Polypropylene Glycol Demand-Supply Scenario, 2015-2030, By Volume 8.10.4.1. Demand 8.10.4.2. Supply 8.10.4.3. Gap 8.10.5. Sweden Polypropylene Glycol Demand Outlook, 2015-2030, By Volume 8.10.5.1. By End Use 8.10.5.2. By Grade 8.10.5.3. By Sales Channel 8.10.5.4. By Company Share (At least top 3 companies’ market share) 8.10.5.5. By Region 8.11. Austria Polypropylene Glycol Market Outlook, 2015-2030 8.11.1. Capacity, By Volume 8.11.1.1. By Company 8.11.1.2. By Location 8.11.2. Production
8.11.2.1. By Company 8.11.3. Operating Efficiency 8.11.3.1. By Company 8.11.4. Austria Polypropylene Glycol Demand-Supply Scenario, 2015-2030, By Volume 8.11.4.1. Demand 8.11.4.2. Supply 8.11.4.3. Gap 8.11.5. Austria Polypropylene Glycol Demand Outlook, 2015-2030, By Volume 8.11.5.1. By End Use 8.11.5.2. By Grade 8.11.5.3. By Sales Channel 8.11.5.4. By Company Share (At least top 3 companies’ market share) 8.11.5.5. By Region 9. MEA Polypropylene Glycol Market Outlook, 2015-2030 9.1. Capacity, By Volume 9.1.1. By Country 9.2. Production 9.2.1. By Country 9.3. Operating Efficiency 9.3.1. By Country 10. MEA Polypropylene Glycol Demand Outlook, 2015-2030, By Volume 10.1. By End Use 10.2. By Grade 10.3. By Sales Channel 10.4. By Country 10.5. Saudi Arabia Polypropylene Glycol Market Outlook, 2015-2030 10.5.1. Capacity, By Volume 10.5.1.1. By Company 10.5.1.2. By Location 10.5.2. Production 10.5.2.1. By Company
10.5.3. Operating Efficiency 10.5.3.1. By Company 10.5.4. Saudi Arabia Polypropylene Glycol Demand-Supply Scenario, 2015-2030, By Volume 10.5.4.1. Demand 10.5.4.2. Supply 10.5.4.3. Gap 10.5.5. Saudi Arabia Polypropylene Glycol Demand Outlook, 2015-2030, By Volume 10.5.5.1. By End Use 10.5.5.2. By Grade 10.5.5.3. By Sales Channel 10.5.5.4. By Company Share (At least top 3 companies’ market share) 10.5.5.5. By Region 10.6. Iran Polypropylene Glycol Market Outlook, 2015-2030 10.6.1. Capacity, By Volume 10.6.1.1. By Company 10.6.1.2. By Location 10.6.2. Production 10.6.2.1. By Company 10.6.3. Operating Efficiency 10.6.3.1. By Company 10.6.4. Iran Polypropylene Glycol Demand-Supply Scenario, 2015-2030, By Volume 10.6.4.1. Demand 10.6.4.2. Supply 10.6.4.3. Gap 10.6.5. Iran Polypropylene Glycol Demand Outlook, 2015-2030, By Volume 10.6.5.1. By End Use 10.6.5.2. By Grade 10.6.5.3. By Sales Channel 10.6.5.4. By Company Share (At least top 3 companies’ market share) 10.6.5.5. By Region. 10.7. South Africa Polypropylene Glycol Market Outlook, 2015-2030
10.7.1. Capacity, By Volume 10.7.1.1. By Company 10.7.1.2. By Location 10.7.2. Production 10.7.2.1. By Company 10.7.3. Operating Efficiency 10.7.3.1. By Company 10.7.4. South Africa Polypropylene Glycol Demand-Supply Scenario, 2015-2030, By Volume 10.7.4.1. Demand 10.7.4.2. Supply 10.7.4.3. Gap 10.7.5. South Africa Polypropylene Glycol Demand Outlook, 2015-2030, By Volume 10.7.5.1. By End Use 10.7.5.2. By Grade 10.7.5.3. By Sales Channel 10.7.5.4. By Company Share (At least top 3 companies’ market share) 10.7.5.5. By Region 11. South America Polypropylene Glycol Market Outlook, 2015-2030 11.1. Capacity, By Volume 11.1.1. By Country 11.2. Production 11.2.1. By Country 11.3. Operating Efficiency 11.3.1. By Country 12. South America Polypropylene Glycol Demand Outlook, 2015-2030, By Volume 12.1. By End Use 12.2. By Grade 12.3. By Sales Channel (Direct/Institutional Sales, Retail Sales, Other Channel Sales) 12.4. By Company Share (At least top 3 companies’ market share) 12.5. By Country 12.6. Brazil Polypropylene Glycol Market Outlook, 2015-2030
12.6.1. Capacity, By Volume 12.6.1.1. By Company 12.6.1.2. By Location 12.6.2. Production 12.6.2.1. By Company 12.6.3. Operating Efficiency 12.6.3.1. By Company 12.6.4. Brazil Polypropylene Glycol Demand-Supply Scenario, 2015-2030, By Volume 12.6.4.1. Demand 12.6.4.2. Supply 12.6.4.3. Gap 12.6.5. Brazil Polypropylene Glycol Demand Outlook, 2015-2030, By Volume 12.6.5.1. By End Use 12.6.5.2. By Grade 12.6.5.3. By Sales Channel 12.6.5.4. By Company Share (At least top 3 companies’ market share) 12.6.5.5. By Region 12.7. Argentina Polypropylene Glycol Market Outlook, 2015-2030 12.7.1. Capacity, By Volume 12.7.1.1. By Company 12.7.1.2. By Location 12.7.2. Production 12.7.2.1. By Company 12.7.3. Operating Efficiency 12.7.3.1. By Company 12.7.4. Argentina Polypropylene Glycol Demand-Supply Scenario, 2015-2030, By Volume 12.7.4.1. Demand 12.7.4.2. Supply 12.7.4.3. Gap 12.7.5. Argentina Polypropylene Glycol Demand Outlook, 2015-2030, By Volume 12.7.5.1. By End Use
12.7.5.2. By Grade 12.7.5.3. By Sales Channel 12.7.5.4. By Company Share (At least top 3 companies’ market share 12.7.5.5. By Region 13. Country-wise Import 14. Country-wise Export 15. News and Deals About Us: ChemAnalyst is ‘one stop’ online portal that offers comprehensive market intelligence data and in-depth analysis on the Global chemical and petrochemical industry. Our aim is to provide competitive advantage to the industry stakeholders by offering ‘cutting edge’ information and analysis that help our customers leverage on the emerging opportunities in their businesses. ChemAnalyst’s team of 100+ analysts are engaged in tracking Chemical Prices daily, production capacity, demand and supply outlook, manufacturing plant locations, foreign trade data and news/deals for more than 400 major chemicals produced in India. ChemAnalyst’s Interactive subscription platform provides the most comprehensive data and analysis in your industry to help you decode the future. ChemAnalyst is promoted by TechSci Research (TSR). TSR is a research-based management consulting firm providing market research and advisory solutions to the customers worldwide, spanning a range of industries including Chemicals & Material, Automotive, Consumer & Retail, ICT, Energy & Power, Aerospace & Defense, Water and Waste Management, BFSI and more. CHEMANALYST B-44, Sector -57, Noida, National Capital Region, UP, India 201301 Tel: +91-120-4523900 Email-id: sales@chemanalyst.com


![Artificial Intelligence Market Size, Share & Growth | Trends [2030]](https://cdn7.slideserve.com/12226439/artificial-intelligence-market-to-reflect-dt.jpg)