Download

1 / 41
430 likes | 681 Views
Single-Subject and Correlational Research. Bring Schraw et al. Scientific America. Single-Subject Research. Chapter Fourteen. Single-subject Research. Chapter Fourteen. Essential Characteristics of Single-subject Research.

E N D
Single-Subject and Correlational Research Bring Schraw et al.
Single-Subject Research Chapter Fourteen
Single-subject Research Chapter Fourteen
Essential Characteristics of Single-subject Research • There are reasons why single subject research is selected instead of the study of groups. • Instruments can be inappropriate at times and intense data collection on a few individuals can make more sense. • Single-subject designs are adaptations of the basic time-series design where data is collected and analyzed for only one subject at a time.
Single-subject Designs • Single-subject designs use line graphs to present their data and to illustrate the effects of a particular intervention or treatment on an individual. • The first condition is usually the baseline, followed by the intervention (independent variable). • Condition lines show if the condition has changed or separated. • Data points represent when the data was collected during the study.
Types of Single-subject Designs • The A-B design. • Exposes the same subject, operating under his or her own control, to two conditions or phases, after establishing a baseline. • The A-B-A design. • Called a reverse design, researchers add another baseline period to the A-B design. • The A-B-A-B design. • Two baseline periods are combined with two treatment periods. • The B-A-B design. • Used when an individual’s behavior is so severe that a researcher cannot wait for a baseline to be established. • The A-B-C-B design. • The “C” condition refers to a variation on the intervention in the “B” condition. The intervention is changed during the “C” phase to control for any extra attention the subject may have received during the “B” phase.
Illustrations of the Results of a Study Involving an A-B-A-B Design
Multiple-Baseline Designs • This is considered an alternative to the A-B-A-B design. • Multiple-baseline designs are typically used when it is not possible or ethical to withdraw a treatment and return to the baseline condition. • Researchers collect data on several behaviors compared to focusing on just one per subject, obtaining a baseline for each during the same period of time. • The researcher applies the treatment at different times for each behavior until all of them are undergoing the treatment. • If behavior changes in each case only after the treatment has been applied, the treatment is judged to be the cause of the change.
Condition length (how long the baseline and intervention conditions are in effect) Number of variables changed when moving from one condition to another (it is important that one variable be changed at a time, when moving from one condition to another) Degree and speed of change (magnitude with which the data change at the time the intervention condition is implemented) Return to baseline level (level should quickly return if the intervention was the causal factor) Independence of behaviors (are behaviors that are being measured dependent upon one another, or related?) Number of baselines (did an extraneous event cause the change during the introduction times?) Threats to Internal Validity in Single-Subject Research The following threats can affect the Internal Validity in Single-Subject Studies
Controlling Threats in a Single-subject Study • Single subject designs are most effective in controlling for the following: • Subject characteristics • Mortality • Testing • History • They are less effective with the following: • Location • Data collector characteristics • Maturation • Regression • They are even weaker with the following: • Collector bias • Attitude • Implementation
External Validity and Single-Subject Research • Single-subject studies are weak when it comes to external validity (i.e., generalizability). • Treatment on one subject would not be appropriate. • As a result, these studies must rely on replications, across individuals rather than groups, if such results are to be found worthy of generalizability.
Correlational Research Chapter Fifteen
Correlational Research Chapter Fifteen
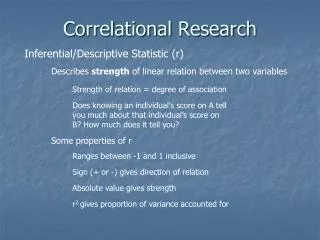
The Nature of Correlational Research • Correlational Research is also known as Associational Research. • Relationships among two or more variables are studied without any attempt to influence them. • Investigates the possibility of relationships between two variables. • There is no manipulation of variables in Correlational Research. Correlational studies describe the variable relationship via a correlation coefficient
(A) (B) (C) r = +1.00 r = -1.00 r = 0 X Y X Y X Y 5 5 5 1 2 1 4 4 4 2 5 4 3 3 3 3 3 3 2 2 2 4 1 5 1 1 1 5 4 2 Three Sets of Data Showing Different Directions and Degrees of Correlation(Table 15.1)
Purpose of Correlational Research • Correlational studies are carried out to explain important human behavior or to predict likely outcomes (identify relationships among variables). • If a relationship of sufficient magnitude exists between two variables, it becomes possible to predict a score on either variable if a score on the other variable is known (Prediction Studies). • The variable that is used to make the prediction is called the predictor variable.
Purpose of Correlational Research(cont.) • The variable about which the prediction is made is called the criterion variable. • Both scatterplots and regression lines are used in correlational studies to predict a score on a criterion variable • A predicted score is never exact. Through a prediction equation (see p. 585), researchers use a predicted score and an index of prediction error (standard error of estimate) to conclude if the score is likely to be incorrect.
Scatterplot Illustrating a Correlation of +1.00(Figure 15.1)
Multiple Regression Technique that enables researchers to determine a correlation between a criterion variable and the best combination of two or more predictor variables Coefficient of multiple correlation (R) Indicates the strength of the correlation between the combination of the predictor variables and the criterion variable Coefficient of Determination Indicates the percentage of the variability among the criterion scores that can be attributed to differences in the scores on the predictor variable Discriminant Function Analysis Rather than using multiple regression, this technique is used when the criterion value is categorical Factor Analysis Allows the researcher to determine whether many variables can be described by a few factors Path Analysis Used to test the likelihood of a causal connection among three or more variables Structural Modeling Sophisticated method for exploring and possibly confirming causation among several variables More Complex Correlational Techniques
Scatterplot Illustrating a Correlation of +1.00 (Figure 15.3)
Scatterplots Illustrating How a Factor (C) May Not be a Threat to Internal Validity (Figure 15.7)
Circle Diagrams Illustrating Relationships Among Variables(Figure 15.8)
Problem selection Choosing a sample Selecting or choosing proper instruments Determining design and procedures Collecting and analyzing data Interpreting results Basic Steps in Correlational Research
What Do Correlational Coefficients Tell Us? • The meaning of a given correlation coefficient depends on how it is applied. • Correlation coefficients below .35 show only a slight relationship between variables. • Correlations between .40 and .60 may have theoretical and/or practical value depending on the context. • Only when a correlation of .65 or higher is obtained, can one reasonably assume an accurate prediction. • Correlations over .85 indicate a very strong relationship between the variables correlated.
Subject characteristics Mortality Location Instrument decay Testing History Data collector characteristics Data collector bias Threats to Internal Validityin Correlational Research The following must be controlled to reduce threats to internal validity