Download
1 / 1
10 likes | 135 Views
0.7. 0.6. 0.5. 0.4. Fura-2 ( t12 – t10 ). 0.3. 0.2. 0.1. n=23. n=37. n=30. 0.0. 1.6. 1.4. 1.2. 1.0. Fura-2 Ratio (AU). 0.8. 0.6. 0.4. 0.2. 0.0. Time (min).

E N D
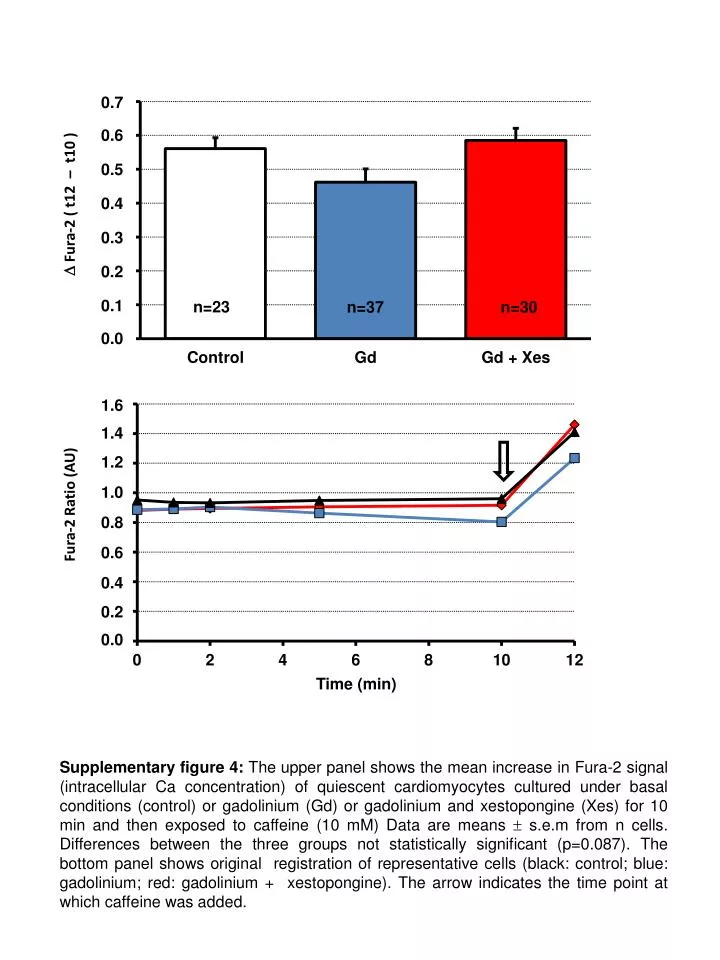
0.7 0.6 0.5 0.4 Fura-2 ( t12 – t10 ) 0.3 0.2 0.1 n=23 n=37 n=30 0.0 1.6 1.4 1.2 1.0 Fura-2 Ratio (AU) 0.8 0.6 0.4 0.2 0.0 Time (min) Supplementary figure 4: The upper panel shows the mean increase in Fura-2 signal (intracellular Ca concentration) of quiescent cardiomyocytes cultured under basal conditions (control) or gadolinium (Gd) or gadolinium and xestopongine (Xes) for 10 min and then exposed to caffeine (10 mM) Data are means s.e.m from n cells. Differences between the three groups not statistically significant (p=0.087). The bottom panel shows original registration of representative cells (black: control; blue: gadolinium; red: gadolinium + xestopongine). The arrow indicates the time point at which caffeine was added.