Download
1 / 17
170 likes | 253 Views
Warm Up. Researchers deigned an observational study to investigate the accepted “normal” body temperature of 98.6F. In the study, 148 healthy men and women ages 18 to 40 had their temperatures taken several times over a three-day period. A total of 700 temperature readings were produced.

E N D
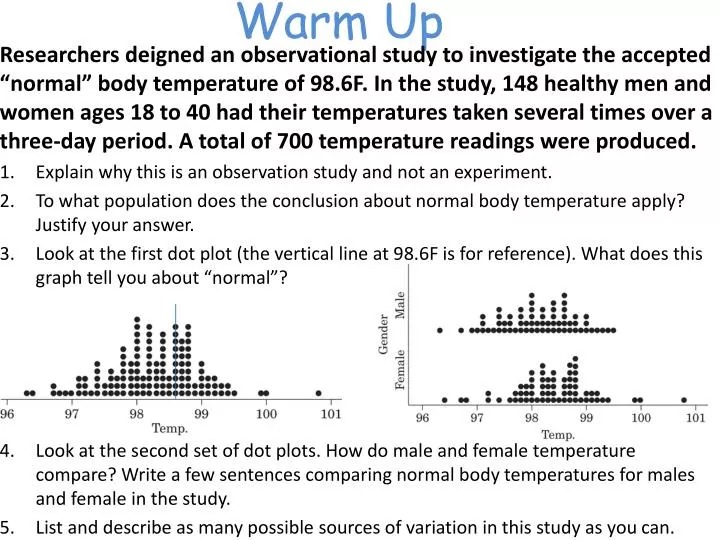
Warm Up Researchers deigned an observational study to investigate the accepted “normal” body temperature of 98.6F. In the study, 148 healthy men and women ages 18 to 40 had their temperatures taken several times over a three-day period. A total of 700 temperature readings were produced. Explain why this is an observation study and not an experiment. To what population does the conclusion about normal body temperature apply? Justify your answer. Look at the first dot plot (the vertical line at 98.6F is for reference). What does this graph tell you about “normal”? Look at the second set of dot plots. How do male and female temperature compare? Write a few sentences comparing normal body temperatures for males and female in the study. List and describe as many possible sources of variation in this study as you can.
Lesson 4: Stem Plots When data is presented without a table or in no specific order like this, what is the data called? • 2 3 4 8 3 4 9 3 5 • 2 7 9 5 3 7 6 2 • 6 7 2 3 5 7 8 4 Raw Data
Definition Sometimes the values of a variable are too spread out for us to make a reasonable dot plot by hand. In these cases, we can consider another simple graphical display called a stem plot—sometimes referred to as stem and leaf plots. Example: 1 1 2 2 2 2 3 3 1 4 4 2 3 4 4 5 5 2 6 1 1 3 7 0
Constructing a Stem & Leaf Plot There are 4 Steps to constructing a stem & leaf plot. They are summarized on pg. 45 of your textbook.
Raw Data At an outpatient testing center, the number of cardiograms performed each day for 20 days is shown. 25 31 20 32 13 14 43 02 57 23 36 32 33 32 44 32 52 44 51 45
Constructing a Stem & Leaf Plot Step 1: Arrange the data in numerical order and separate/group according to the first digit Original Raw Data 25 31 20 32 13 14 43 02 57 23 36 32 33 32 44 32 52 44 51 45
Constructing a Stem & Leaf Plot Step 2: Separate data into A stem, the leading digits, consisting of all but the right-most digit A leaf, the final digit Stems may have as many digits as needed, but each leaf contains only a single digit.
Constructing a Stem & Leaf Plot Step 3: Separate data putting the leading digit in the left column with the smallest at the top and all of the final digits in their corresponding rows in increasing order Leading digit (stem) Final Digit (leaf) 0 1 2 3 4 5 2 3 4 0 3 5 1 2 2 2 2 3 6 3 4 4 5 1 2 7
Constructing a Stem & Leaf Plot Step 4: Divide the leading digit and trailing digit by a vertical line 0 1 2 3 4 5 2 3 4 0 3 5 1 2 2 2 2 3 6 3 4 4 5 1 2 7 _______________________
Try one on your own: A particular class of 18 students took a test and the grades were: 75 82 92 88 64 81 61 84 77 97 66 73 88 89 79 88 77 69
Answer A particular class of 18 students took a test and the grades were: 1 4 6 9 3 5 7 7 9 1 2 4 8 8 8 9 2 7 6 7 8 9 _________________________
Key Concept To see the overall pattern of a distribution, ignore any outliers. Describe the overall pattern of the distribution by giving the center and the spread, and see if the distribution has a simple shape that you can describe in a few words.
Key Concept Shape: Center: Spread:
Key Concept • Whether you’re given raw data or the stem & leaf plot you will have to find…. • Mean: • Median: • Mode: • Range:
Examples Raw Data 15 22 31 40 17 32 42 18 25 31 32 41 41 41 15 20 Mean: Median: Mode: Range:
Examples Stem Plot 1 5 5 7 2 0 2 5 3 1 1 2 2 4 0 1 1 1 Mean: Median: Mode: Range:
Homework: Questions on pg. 46-59#’s 2.8, 2.11, 2.12, 2.19, 2.26Mean, Median, Mode, & Range Worksheet