Download
1 / 30
310 likes | 542 Views
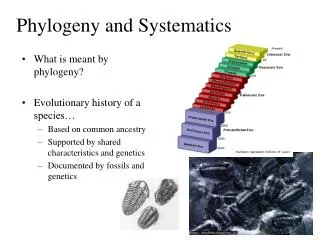
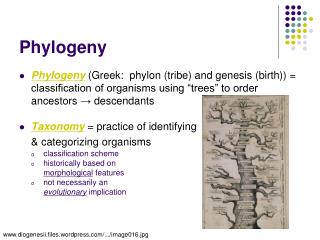
18S rRNA and Tetrapod Phylogeny. Xuhua Xia xxia@uottawa.ca http://aix1.uottawa.ca/~xxia. Why Phylogenetics?. Ailuridae Procyonidae Ailuropodidae Procyonidae Ursidae. 1860. 1880. 1900. 1920. 1940. 1960. 1980. Tetrapod Phylogeny. OutGroup. OutGroup. “Reptil ian ”. Mammal.

E N D
18S rRNA and Tetrapod Phylogeny Xuhua Xia xxia@uottawa.ca http://aix1.uottawa.ca/~xxia
Why Phylogenetics? Ailuridae Procyonidae Ailuropodidae Procyonidae Ursidae 1860 1880 1900 1920 1940 1960 1980 Slide 2
Tetrapod Phylogeny OutGroup OutGroup “Reptilian” Mammal Mammal Bird Bird “Reptilian” • Early Controversy: • Birds are more closely related to “reptilians” (Carroll, 1988; Gauthier et al., 1988; Romer, 1966) • Birds are more closely related to mammals (Owen 1866: Haematothermia; Gardiner, 1982: Haemothermia; Løvtrup, 1985). Slide 3
Support for the Bird-“Reptilian” Grouping Xenopus laevis: toad Mus musculus: mouse Homo sapiens: human Heterodonplatyrhinos: snake Pseudemys scripta: turtle Alligagor mississippiensis: alligator Turdus migratorius: robin Gallus gallus: chicken • Molecular data: Protein-coding genes from nuclear and mitochondrial DNA; non-18S rRNA genes (Ausio et al., 1999; Caspers et al., 1996; Hedges, 1994; Janke and Arnason, 1997; Seutin et al., 1994; Zardoya and Meyer, 1998) • Morphological and paleontological data (Reviewed in Eernisse and Kluge, 1993) Slide 4
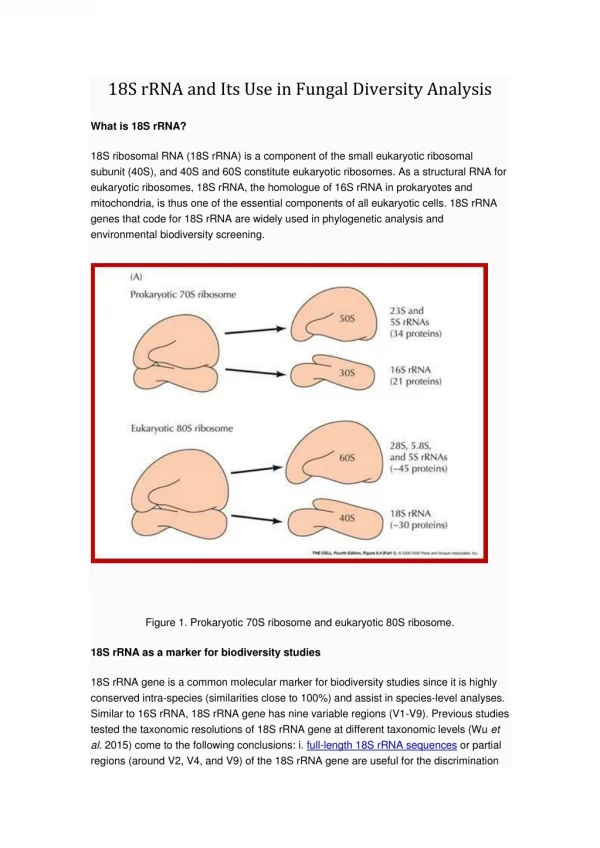
18S rRNA & Bird-Mammal Grouping • Hedges et al (1990); Hedges and Maxson (1992): 18S rRNA sequences strongly support the bird-mammal grouping against the bird-reptilian grouping. • Rzhetsky and Nei (1992): A subset of the 18S rRNA sequences was used in a statistical test, based on the minimum evolution criterion, to evaluate relative support of these alternative hypotheses. The nine shortest trees all group the avian and mammalian species together as a monophyletic taxon. • What has gone wrong with the 18S rRNA? Slide 5
Main Problems in Phylogenetics • Sequence quality • Substitution saturation and long-branch attraction • Sequence alignment • Biased estimate • Insufficient substitution model Slide 6
18S rRNA: FiveKinds of Bias: I • Marshall, 1992 • Substitution saturation and long-branch attraction • The weighted parsimony method (Fitch et al., 1995; Williams and Fitch, 1990) • Starting tree-dependent • Sequence divergence between the amphibians and the amniotes is only 4.4% Slide 7
18S rRNA: FiveKinds of Bias: II • Eernisse and Kluge, 1993: • Sequence misalignment • Sequence realigned. • Did the annoying bird-mammal grouping disappear? Slide 8
Van de Peer et al., 1993: The 18S rRNA is made of conserved and the variable domains Both the indel and the nucleotide substitution events occur mostly in the eight variable domains The divergence between sequences with the shortest variable domains may be underestimated. Indel-containing sites were deleted in previous studies. 18S rRNA: FiveKinds of Bias: III AACCGCAAC-GGCCC AACC---AC-GGCCC AACCG-----GGCCC AACCGCTCCGGGCCC AACCTCCCCCGGCCC Variable domain Slide 9
18S rRNA: FiveKinds of Bias: IV • Two kinds of transitions • TC • AG • C-G pair and U-G pair in rRNA sequences • Mostly TC • Tamura and Nei (1993) • Did the annoying bird-mammal grouping disappear? ACUCCGAGAA |||||||||| UGAGGCUCUU Slide 10
18S rRNA: FiveKinds of Bias: V • Huelsenbeck and Bull, 1996; Huelsenbeck et al., 1996 • Birds and mammals tend to be more GC-rich than those of poikilotherms (Bernardi, 1993) • Nonstationary substitution process: the LogDet (Lockhart et al., 1994) distance • Did the annoying bird-mammal grouping disappear? Slide 11
18S rRNA is a Bad Gene!!! • After applying a whole batteries of phylogenetic analyses to the 18S rRNA sequences and still cannot put the bird-mammal grouping out of the way, Huelsenbeck et al. (1996) claimed that their analysis“offers definitive evidence of different genes providing significantly different estimates of phylogeny in higher organisms”. • The easy fallback: the gene tree does not reflect the species tree. • Is the 18S rRNA gene really a bad gene? Slide 12
The negligence of the obvious • Aligning sequences of very different lengths with different nucleotide bias • Secondary structure in RNA may confound the conventional alignment algorithms Slide 13
The negligence of the obvious I. Aligning sequences of very different lengths II. Frequency paremeters
I. Sequence Alignment • Aligning long mammalian 18S rRNA sequences against short avian and reptilian sequences 10 20 30 40 ----|----|----|----|----|----|----|----| Seq1 A-CC-----GC--------GA--CUUC--GA-CC-CG--G Seq2 A-CC-----GU--------GA--CUUG--GA-CC-CG--G Seq3 AACCCCGGUGUAGGGGGAAGAACCUUGAUGAACCUCGAUG Seq4 AACCCCGGUGCAGGGGGAAGAACCUUCAUGAACCUCGAUG Seq1 ACCGCGACUUCGACCCGG Seq2 ACCGUGACUUGGACCCGG Seq3 ACCGUGACUUGGACCCGG Seq4 ACCGCGACUUCGACCCGG Slide 15
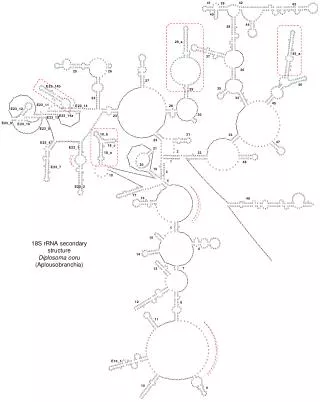
Alignment with secondary structure Sequences:Seq1: CACGACCAGATCTCGTGSeq2: CACGGCCAGATCCGTG Conventional alignment: Seq1: CACGACCAGATCTCGTG Seq2: CACGGCCAGATC-CGTG Known secondary structure: CC Seq1: CACGA A ||||| G GUGCU A CU CC Seq1: CACGG A ||||| G GUGCC A U Correct alignment: Seq1: CACGACCAGATCTCGTG Seq2: CACGGCCAGAT-CCGTG Hickson et al., 2000; Kjer, 1995; Notredame et al., 1997 Slide 16
Standard and Non-standard Base Pairing N H 2 N N N N H O O N N N N H H N N N N N N H H H H 2 2 N H 2 N O CH3 N O H O N N N O H N O H A/T G/U G/C Slide 17
Secondary Structure Determination ---ACUCCGAGAA |||||||||| ---UGAGGCUCUU ---ACUGCGCGCA ||| || | | ---UGAGGCUCUU ---GCUCCGAGAG |||||||||| ---UGGGGCUCUU • RNA sequence:--ACUCCGAGAACGGUAGAAUUCUCGGAGU-- • Energy Minimization • Melting Temperature • Comparative Sequence Analysis Watson- Crick (WC) Canonical Non-canonical --ACUCCGAGAACGGUAGAAUUCUCGGAGU— --ACUCCAAGAACGGUAGAAUUCUUGGAGU-- Slide 18
rRNA databases • rRNA WWW server (Van de Peer et al., 2000) at http://rrna.uia.ac.be/ssu/ • The Ribosomal Database Project II (Maidak et al., 2000) at ftp://ftp.cme.msu.edu/pub/RDP • Special alignment method used • Many intermediate sequences needed to infer secondary structure Slide 19
II. The Frequency Parameters AACCGCAAC-GGCCC AACC---AC-GGCCC AACCG-----GGCCC AACCGCTCCGGGCCC AACCTCCCCCGGCCC Variable domain • Revisiting the substitution model: • The frequency parameters • The rate ratio parameters • The variable domains differ from the conserved domains substantially in nucleotide frequencies. • The consequence of deleting all indel-containing sites: biased estimate of frequency parameters. Slide 20
The Two Hypotheses OutGroup OutGroup “Reptilian” Mammal Mammal Bird Bird “Reptilian” Slide 21
Materials and Methods • Sequence data for eight species • rRNA WWW server at http://rrna.uia.ac.be/ssu/ • The Ribosomal Database Project II at ftp://ftp.cme.msu.edu/pub/RDP • Phylogenetic methods • Maximum parsimony • Distance method: Neighbor-joining with Lake’s paralinear distance. • Maximum likelihood: TN93 model Slide 22
Results: Data from rRNA Server X. laevis 100 M. musculus H. sapiens Neighbor-joining 83 H. platyrhinos 99 76 P. scripta A. mississippiensis 100 T. migratorius G. gallus X. laevis 100 M. musculus H. sapiens Maximum Parsimony 46 H. platyrhinos 39 P. scripta 54 A. mississippiensis 99 T. migratorius G. gallus X. laevis 100 M. musculus H. sapiens Maximum Likelihood 90 H. platyrhinos 99 P. scripta 72 A. mississippiensis 99 Slide 23 T. migratorius G. gallus
X. laevis Results: Data from RDP II 100 M. musculus H. sapiens H. platyrhinos 58 36 P. scripta 85 A. mississippiensis 65 G. gallus T. migratorius X. laevis 100 M. musculus H. sapiens A. mississippiensis 99 P. scripta 62 39 H. platyrhinos 96 G. gallus T. migratorius X. laevis 100 M. musculus H. sapiens A. mississippiensis 80 59 P. scripta 100 H. platyrhinos 85 G. gallus T. migratorius Slide 24
Evaluating Alternative Hypotheses OutGroup OutGroup “Reptilian” Mammal Mammal Bird Bird “Reptilian” Slide 25
Evaluating Alternative Hypotheses • Is the best tree significantly better than the alternative? • best, alternative, D= best - alternative, sD, z = D /sD • With the minimum-evolution criterion, is the total tree length • With the maximum parsimony criterion, is the total number of steps (number of changes). • With the maximum likelihood criterion, is the log-likelihood Slide 26
The RELL Test Site lnL_B lnL_A Di 1 lnL_B1 lnLA_1 D1 2 lnL_B2 lnLA_2 D2 . . . . . . . . . N lnL_BN lnLA_N DN • RELL: Resample-estimated log-likelihood • The two versions of the RELL test • The classic RELL test • lnL(best) and lnL(alternative) • D = lnL(best) – lnL(alternative) • Var(D) obtained by bootstrapping • DNAML: paired-sample t-test Slide 27
Results of the Test OutGroup OutGroup Reptilian Mammal Mammal Bird Bird Reptilian • P = ~0.271 for the data from the rRNA Server • P = ~0.103 for the data from the RDP II Slide 28
Conclusions • Better alignment and the appropriate frequency parameters show that the 18S rRNA gene is not telling lies, and the bird-reptilian grouping is supported, especially when the neighbor-joining and the maximum likelihood method is used. • However, the alternative topology cannot be rejected conclusively based on the 18S rRNA sequences alone. • The bottom line: When you see different topologies from different genes, think twice before attributing the difference to different gene trees not reflecting the true species tree. Slide 29
Why Phylogenetics? Ailuridae Procyonidae Ailuropodidae Procyonidae Ursidae 1860 1880 1900 1920 1940 1960 1980 Slide 30