Download
1 / 4
40 likes | 117 Views
100. 102. 2008*. 2004. Loans. 2004. 2008*. (in % of GDP). Poland. 30. 32. Hungary. 41. 51. 80. Czech Rep. 33. 42. Slovakia. 29. 36. Slovenia. 46. 56. Estonia. 47. 65. 60. Latvia. 51. 65. Lithuania. 29. 41. Croatia. 62. 68. Bulgaria. 35. 52. 40. Romania. 18.

E N D
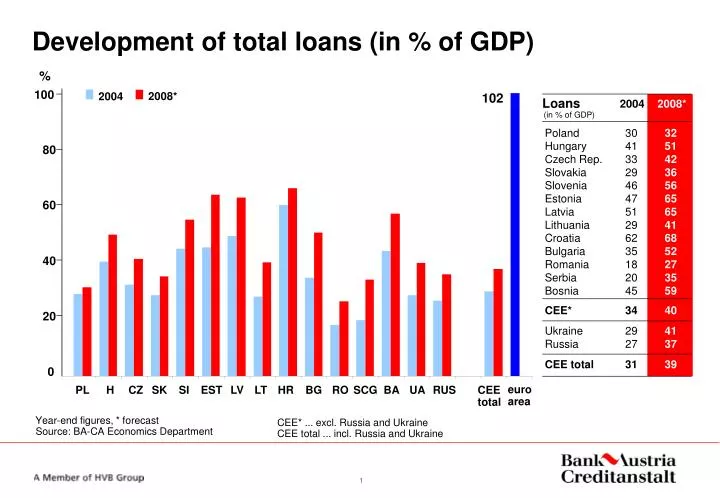
100 102 2008* 2004 Loans 2004 2008* (in % of GDP) Poland 30 32 Hungary 41 51 80 Czech Rep. 33 42 Slovakia 29 36 Slovenia 46 56 Estonia 47 65 60 Latvia 51 65 Lithuania 29 41 Croatia 62 68 Bulgaria 35 52 40 Romania 18 27 Serbia 20 35 Bosnia 45 59 CEE* 34 40 20 Ukraine 29 41 Russia 27 37 CEE total 31 39 0 PL H CZ SK SI EST LV LT HR BG RO SCG BA UA RUS CEEtotal euro area CEE* ... excl. Russia and Ukraine CEE total ... incl. Russia and Ukraine Development of total loans (in % of GDP) % Year-end figures, * forecast Source: BA-CA Economics Department
euros 4000 2008* 2004 ~12.400 Personal loans 2004 2008* (per capita in euros) Poland 688 1062 Hungary 1185 2140 3000 Czech Rep. 966 1930 Slovakia 625 1391 Slovenia 1586 2471 Estonia 1545 3474 Latvia 860 1796 Lithuania 373 878 2000 Croatia 1979 2877 Bulgaria 287 673 Romania 135 464 Serbia 111 301 Bosnia 352 648 1000 CEE* 640 1170 Ukraine 53 242 Russia 120 441 0 CEE total 308 689 HR BG RO SCG BA UA RUS PL H CZ SK SI EST LV LT CEEtotal euroarea CEE* ... excl. Russia and Ukraine CEE total ... incl. Russia and Ukraine Development of personal loans (per capita in euros) Year-end figures, * forecast Source: BA-CA Economics Department
% Deposits 80 2008* 2004 2008* 2004 (in % of GDP) 73 Poland 39 37 Hungary 40 42 Czech Rep. 64 65 60 Slovakia 53 53 Slovenia 51 52 Estonia 44 54 Latvia 31 38 Lithuania 27 34 Croatia 60 62 40 Bulgaria 39 48 Romania 24 30 Serbia 20 29 Bosnia 41 54 20 CEE* 43 44 Ukraine 23 33 Russia 16 22 CEE total 31 32 0 PL H CZ SK SI EST LV LT HR BG RO SCG BA UA RUS CEEtotal euroarea CEE* ... excl. Russia and Ukraine CEE total ... incl. Russia and Ukraine Development of total deposits (in % of GDP) Year-end figures, * forecast Source: BA-CA Economics Department
euros 6000 2004 2008* ~13.600 5000 Deposits 2004 2008* (per capita in euros) Poland 1272 1651 Hungary 2073 2694 4000 Czech Rep. 3262 4502 Slovakia 1961 2373 Slovenia 4908 6075 Estonia 1292 2054 3000 Latvia 832 1361 Lithuania 811 1464 Croatia 2687 3497 Bulgaria 591 1069 2000 Romania 415 1095 Serbia 221 437 Bosnia 352 637 1000 CEE* 1331 1898 Ukraine 142 376 Russia 387 962 0 CEE total 710 1230 CEEtotal euroarea PL H CZ SK SI EST LV LT HR BG RO SCG BA UA RUS CEE* ... excl. Russia and Ukraine CEE total ... incl. Russia and Ukraine Development of personal deposits (per capita in euros) Year-end figures, * forecast Source: BA-CA Economics Department