Download
1 / 17
180 likes | 325 Views
Confirmatory Factor Analysis of Longitudinal Data. David A. Kenny. Task. Same set of measures that form a latent variables are measured at two or more times on the same sample. Example Data. Dumenci, L., & Windle , M . (1996 ). Multivariate Behavioral Research, 31 , 313-330.

E N D
Confirmatory Factor Analysis of Longitudinal Data David A. Kenny
Task Same set of measures that form a latent variables are measured at two or more times on the same sample.
Example Data Dumenci, L., & Windle, M. (1996). Multivariate Behavioral Research, 31, 313-330. Depression with four indicators (CESD) PA: Positive Affect (lack thereof) DA: Depressive Affect SO: Somatic Symptoms IN: Interpersonal Issues Four times separated by 6 months 433 adolescent females Age 16.2 at wave 1
Equal Loadings Over Time • Want to test that the factor loadings are the same at all times. • If the loadings are the same, then it becomes more plausible to argue that one has the same construct at each time. • Many longitudinal models requires temporally invariant loadings.
Correlated Measurement Error • Almost always with longitudinal data, the errors of measurement of an indicator (technically called uniquenesses) should be correlated. • To be safely identified, at least, three indicators are needed. • Identified with just two indicators, but must assume the loadings are equal (i.e., both set to one).
Equal Error Variances • Another possibility is that error variance of the same measure at different times are equal. • As in the example with four indicators at four times, each indicator would have one error variance for each of the four times, a total of 12 constraints.
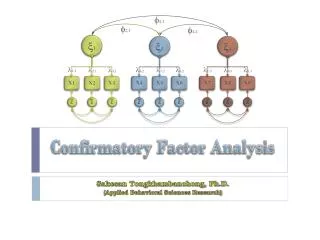
Correlated Errors Equal Error Variances Equal Loadings
Conclusion • Definitely need correlated errors in the model (something that will almost always be the case). • Forcing equal loadings, while worsening the fit some, seems reasonable in this case. • Equal error variances is also reasonable.
Means of a Latent Variable • Fix the intercept of the marker variable at each time to zero. • Free the other intercepts but set them equal over time; a total of (k – 1)(T – 1) constraints. • 9 constraints for the example dataset • Free factor means and see if the model fits.
Equality of the Means of a Latent Variable • Assuming good fit of a model with latent means, fix the factor means (m1 = m2 = m3 = m4) to be equal to test the equality of factor means; T – 1 df.
Example Means: Latent Variable, Base Model • Model with No Constraints on the Means • c2(83) = 123.66, p = .003 • RMSEA = 0.034; TLI = .985 • Model with Latent Means and Constraints on the Intercepts • c2(92) = 157.49, p = .003 • RMSEA = 0.041; TLI = .979 • Fit is worse with the constraints, but the model fit (RMSEA and TLI) are acceptable. • Can test if means differ.
Example Means: Latent Variable • The four means: 25.34, 25.82, 21.72, 20.09 • Base Model • c2(92) = 157.49, p = .003 • RMSEA = 0.041; TLI = .979 • Equal Latent Means • c2(95) = 182.94, p < .001 • RMSEA = 0.046; TLI = .973 • Test of the null hypothesis of equal variance: c2(3) = 25.44, p < .001 • Conclusion: Means differ.
Equal Variance: Latent Variable • Fix the T factor variances to be equal (s1 = s2 = s3 = s4). • Compare this model to a model in which factor variances are free to vary with T – 1 df.
Example: Latent Variable • The four latent variances: 25.34, 25.82, 21.72, 20.09 • Base Model • c2(83) = 123.66, p = .003 • RMSEA = 0.034; TLI = .985 • Equal Variances • c2(86) = 133.43, p = .001 • RMSEA = 0.036; TLI = .984 • Test of the null hypothesis of equal variance: • c2(3) = 9.76, p = .021 • Variances significantly different, but model fit is not all that different from the base model.