Download
1 / 5
50 likes | 176 Views
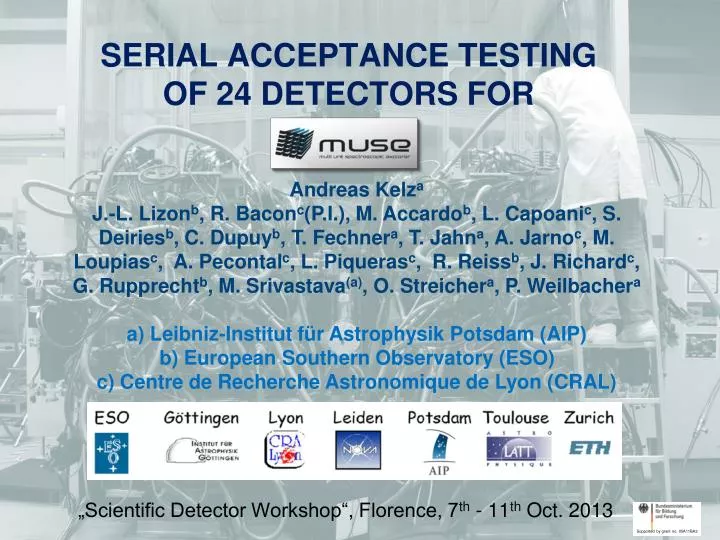
Andreas Kelz a J.-L. Lizon b , R. Bacon c (P.I.), M. Accardo b , L. Capoani c , S. Deiries b , C. Dupuy b , T. Fechner a , T. Jahn a , A. Jarno c , M. Loupias c , A. Pecontal c , L. Piqueras c , R. Reiss b , J. Richard c , G. Rupprecht b , M. Srivastava (a) , O. Streicher a , P. Weilbacher a

E N D
Andreas Kelza J.-L. Lizonb, R. Baconc(P.I.), M. Accardob, L. Capoanic, S. Deiriesb, C. Dupuyb, T. Fechnera, T. Jahna, A. Jarnoc, M. Loupiasc, A. Pecontalc, L. Piquerasc, R. Reissb, J. Richardc, G. Rupprechtb, M. Srivastava(a), O. Streichera, P. Weilbachera a) Leibniz-Institut für Astrophysik Potsdam (AIP) b) European Southern Observatory (ESO) c) Centre de Recherche Astronomique de Lyon (CRAL) „Scientific Detector Workshop“, Florence, 7th - 11th Oct. 2013 Serial Acceptance Testing of 24 Detectors for Supported by grant no. 05A11BA2
MUSE overview MUSE, a second-generation VLT 3D-spectrograph • Field of View: 60 x 60 acrseconds • Spatial resolution: 0.2 arcseconds • Spatial elements: 60,000 • Spectral range: 465nm – 930nm • 24 spectrographs with detector systems • Adaptive Optics enhanced mode The MUSE consortium: (P.I.: R. Bacon, CRAL)
MUSE detector system: AIT process CCD231 4k x 4k, 15 mm 8) Operating-SW by LATT, DR-SW by AIP & CRAL 1) design @ ESO 7) Integration & perfomance verification @ CRAL. Vacuum- and cryo- system by ESO Production cycle of 24 MUSE detector heads 2) head mechanical assembly @ AIP 3) chip integration & alignment @ ESO 6) Acceptance test at spectrograph @ AIP 4) CCD character- isation @ ESO 5) transport to AIP
Figure 1: Gain values for all quadrants and all channels. The dashed line displays the median value. Figure 3: Measured dark current for the 24 channels. The dash line shows the specification. Figure 6: Read-out noise measurement performed after shutting down all external electrical sources, except NGCs. Figure 2: Maximum relative non-linearity for the 4 quadrants of each channel. Figure 5: Readout noise for all channels. The mean value and peak-to-peak variation for the 4 quadrants are plotted. The dashed line displays the specification. Performance of 24 detectors(from VLT-TRE-MUS-1379 technical report to ESO) Dark current: 1.1 e-/hour Non-linearity: 0.3 % Gain: 1.2 ADU/e- Readnoise @ quite mean: 2.1 e- Readnoise @ load Remanence: <0.05 e- Figure 4: Measured remanence level for each channel after medium (blue) and high (red) saturation.
Acceptance test with spectrograph Fig 10: example of detector shift and rotation measured across the CCD. Fig 12: relative x and y shifts (top) and tilts (bottom) for all CCDs with allowed margins (green box). Fig 11: spectrograph focus curves and image quality histograms in three-colours.