Download
1 / 11
110 likes | 272 Views
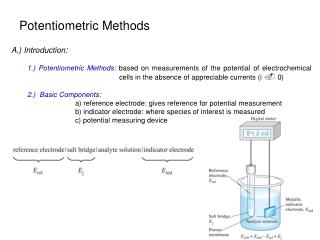
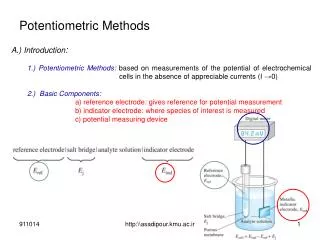
Albumin Analysis by Potentiometric Method. Properties of Albumin. Half-life: 17 to 23 days Molecular weight: 68,000 Isoelectric point: 4.8. The Advantages of Potentiometric Method. 1. Integrate easily 2. Micro-fabricate easily 3. Real time response. Operation with lab potentiostat.

E N D
Properties of Albumin • Half-life: 17 to 23 days • Molecular weight: 68,000 • Isoelectric point: 4.8
The Advantages of PotentiometricMethod • 1. Integrate easily • 2. Micro-fabricate easily • 3. Real time response
Y=-2.10*X-0.827 R-Squared=0.961 Fig 1. The calibration curve between potential change and ln( albumin concentration ) WE:Graphite, CE: Pt, RE: Ag/AgCl, Electrolyte: 0.5 M KCl
X=-1.78*X+2.89 R-Squared=0.967 Fig 2. The calibration curve between potential change and ln( albumin concentration ) WE:Graphite with MIP(DMAPMA/TEGDMA=1/20), CE: Pt, RE: Ag/AgCl, Electrolyte: 0.5 M KCl
Y=-14.1*X+0.737 R-Squared=0.928 Fig 3. The calibration curve between potential change and ln( albumin concentration ) WE:Au wire(diameter1.2mm, 99.95% purity) , CE: Pt, RE: Ag/AgCl, Electrolyte: 0.5 M KCl
Y=-21.6*X+37.4 R-Squared=0.576 Fig 4. Thecalibration curve between potential change and ln( albumin concentration ) WE:Au wire(diameter 1.2mm, 99.95 % purity) with MIP( DMAPMA/ TEGDMA)=1/20), CE: Pt, RE: Ag/AgCl, Electrolyte: 0.5 M KCl
Y=-7.76*X+0.379 R-Squared=0.955 Fig 5. The calibration curve between potential change and ln( albumin concentration ) WE:screen-printing Au with MIP(DMAPMA/TEGDMA=1/20), CE: Pt, RE: Ag/AgCl, Electrolyte: 0.5 M KCl, Modification agent: 3-mercaptopropionic acid
Y=-12.0*X+12.2 R-Squared=0.852 Fig 6. The calibration curve between potential change and ln( albumin concentration ) WE:screen-printing Au with MIP(DMAPMA/TEGDMA=1/20), CE: Pt, RE: Ag/AgCl, Electrolyte: 0.5 M KCl, Modification agent: 2-mercaptoethanol
Y=-11.0*X-3.52 R-Squared=0.905 Fig 7. The calibration curve between potential change and ln( albumin concentration ) WE:aluminum oxide with polyquaternary polymer film (DMAEMMC/TEGDMA=1/12), CE: Pt, RE: Ag/AgCl, Electrolyte: 0.5 M KCl