Download
1 / 53
530 likes | 651 Views
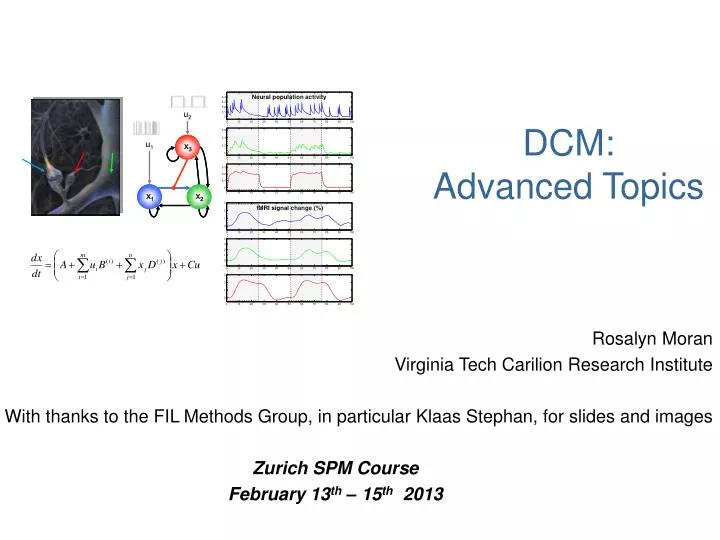
DCM: Advanced Topics. Rosalyn Moran Virginia Tech Carilion Research Institute With thanks to the FIL Methods Group, in particular Klaas Stephan, for slides and images Zurich SPM Course February 13 th – 15 th 2013. Outline. Bayesian model selection (BMS)

E N D
DCM: Advanced Topics Rosalyn Moran Virginia Tech Carilion Research Institute With thanks to the FIL Methods Group, in particular Klaas Stephan, for slides and images Zurich SPM Course February 13th – 15th 2013
Outline • Bayesianmodelselection (BMS) • Embedding computationalmodels in DCMs • IntegratingtractographyandDCM • Stochastic DCM
Outline • Bayesianmodelselection (BMS) • Embedding computationalmodels in DCMs • IntegratingtractographyandDCM • Stochastic DCM
definition of model space inference on model structure or inference on model parameters? inference on individual models or model space partition? inference on parameters of an optimal model or parameters of all models? optimal model structure assumed to be identical across subjects? comparison of model families using FFX or RFX BMS optimal model structure assumed to be identical across subjects? BMA yes no yes no FFX BMS RFX BMS FFX BMS RFX BMS FFX analysis of parameter estimates (e.g. BPA) RFX analysisofparameterestimates (e.g. t-test, ANOVA) Stephan et al. 2010, NeuroImage
Pitt & Miyung (2002) TICS Model comparison and selection Given competing hypotheses on structure & functional mechanisms of a system, which model is the best? Which model represents thebest balance between model fit and model complexity? For which model m does p(y|m) become maximal?
M3 attention M2 better than M1? PPC stim V1 V5 M4 attention PPC stim V1 V5 Bayesian Model Selection attention M1 M2 Relative Log Model Evidence PPC PPC attention V1 stim V5 V1 stim V5 M3 M1 M4 M2 M3 better than M2 / M1 ? Posterior Model Probability M4 better than M3/M2/M1?
M4 attention PPC stim V1 V5 Bayesian Model Selection Relative Log Model Evidence M3 M1 M4 M2 Cannot change the data Must keep all time series Can “disconnect” Nodes Tend to report “M4 - M3” Posterior Model Probability
Bayes factors For a given dataset, to compare two models, we compare their evidences. positive value, [0;[ Kass & Raftery classification: or their log evidences Kass & Raftery 1995, J. Am. Stat. Assoc.
Approximations to the model evidence in DCM Maximizing log model evidence = Maximizing model evidence Logarithm is a monotonic function Log model evidence = balancebetween fit andcomplexity No. of parameters In SPM2 & SPM5, interface offers 2 approximations: No. of data points Akaike Information Criterion: Bayesian Information Criterion: AIC favours more complex models, BIC favours simpler models. Penny et al. 2004, NeuroImage
The negative freeenergyapproximation KL F balancebetween fit andcomplexity = accuracy - complexity Deviation of posterior mean from prior mean Independent Priors Dependent Posteriors
Fixed effects BMS atgrouplevel Log Group Bayesfactor (GBF)for 1...Ksubjects: Problems: • blind withregardtogroupheterogeneity • sensitive tooutliers Select one of K models
Fixed vsRandomeffects A model for each subject Stephan et al. 2009, NeuroImage
estimate the parameters of the posterior Random effects BMS for group studies Dirichlet parameters = “occurrences” of models in the population Dirichlet distribution of model probabilities Multinomial distribution of model labels Model inversion by Variational Bayes (VB) Measured data y Stephan et al. 2009, NeuroImage
LD LD|LVF LD|RVF LD|LVF LD LD RVF stim. LD LVF stim. RVF stim. LD|RVF LVF stim. MOG MOG MOG MOG LG LG LG LG FG FG FG FG Winner! Fixed Effects m2 m1 m2 m1 Stephan et al. 2009, NeuroImage
RFX Analysis m1 m2
definition of model space inference on model structure or inference on model parameters? inference on individual models or model space partition? inference on parameters of an optimal model or parameters of all models? optimal model structure assumed to be identical across subjects? comparison of model families using FFX or RFX BMS optimal model structure assumed to be identical across subjects? BMA yes no yes no FFX BMS RFX BMS FFX BMS RFX BMS FFX analysis of parameter estimates (e.g. BPA) RFX analysisofparameterestimates (e.g. t-test, ANOVA) Stephan et al. 2010, NeuroImage
Families of Models Dynamics of intelligible speech vs reversed speech, (Leff et al. 2008): “She came out of the house”/ ”esuohehtfotuoemacehS” Posterior Superior Temporal Sulcus (P) P F Pars Orbitalis of Inferior Frontal Gyrus (F) A Anterior Superior Temporal Sulcus (A) Where does the auditorydriving input enter?
Families of Models P F P A F A P F A P Family: f1 F A
Families of Models P P F F P P A A F F A A P P F F A A P P Family: f2 Family: f1 F F A A
Families of Models P P F F P P A A F F A A P P F F A A P P Family: f2 Family: f1 Where does the driving input enter? F F Partition A A
Families of Models f1 f2 P P F F P P A A F F A A P P RFX: FFX: F F A A P P F F A A
Parameters of a family e.g. Modulatory connections P F P A * F Winning Family: f1 A P F * A P BMA: weight posterior parameter densities with model probabilities F A Penny et al., 2010
definition of model space inference on model structure or inference on model parameters? inference on individual models or model space partition? inference on parameters of an optimal model or parameters of all models? optimal model structure assumed to be identical across subjects? comparison of model families using FFX or RFX BMS optimal model structure assumed to be identical across subjects? BMA yes no yes no FFX BMS RFX BMS FFX BMS RFX BMS FFX analysisofparameterestimates (e.g. BPA) RFX analysisofparameterestimates (e.g. t-test, ANOVA) Stephan et al. 2010, NeuroImage
Outline • Bayesianmodelselection (BMS) • Embedding computationalmodels in DCMs • IntegratingtractographyandDCM • Stochastic DCM
Conditioning Stimulus Target Stimulus or 1 0.8 or 0.6 CS TS Response 0.4 0 200 400 600 800 2000 ± 650 CS 1 Time (ms) CS 0.2 2 0 0 200 400 600 800 1000 Learning of dynamic audio-visual associations p(face) trial den Ouden et al. 2010, J. Neurosci .
k vt-1 vt rt rt+1 ut ut+1 Bayesian learning model volatility probabilistic association observed events Changes over trials: Model Based Regressor Behrens et al. 2007, Nat. Neurosci.
1 True Bayes Vol HMM fixed 0.8 HMM learn RW 0.6 p(F) 0.4 0.2 0 400 440 480 520 560 600 Trial Comparison with competing learning models Alternative learning models: Rescorla-Wagner HMM (2 variants) True probabilities BMS: hierarchical Bayesian learner performs best den Ouden et al. 2010, J. Neurosci .
p < 0.05 (SVC) 0 0 -0.5 -0.5 BOLD resp. (a.u.) BOLD resp. (a.u.) -1 -1 -1.5 -1.5 -2 -2 p(F) p(H) p(F) p(H) Stimulus-independent prediction error Putamen Premotor cortex p < 0.05 (cluster-level whole- brain corrected) den Ouden et al. 2010, J. Neurosci .
Prediction error (PE) activity in the putamen PE during reinforcement learning O'Doherty et al. 2004, Science PE during incidental sensory learning According to the free energy principle (and other learning theories): synaptic plasticity during learning = PE dependent changes in connectivity
Prediction error in PMd: cause or effect? Model 1 Model 2 den Ouden et al. 2010, J. Neurosci . Bilinear: Nonlinear:
Prediction error in PMd: cause or effect? Model 1 Model 2 den Ouden et al. 2010, J. Neurosci .
Prediction error gates visuo-motor connections • Modulation of visuo-motor connections by striatal PE activity • Influence of visual areas on premotor cortex: • stronger for surprising stimuli • weaker for expected stimuli p(H) p(F) PUT d = 0.011 0.004 p = 0.017 d = 0.010 0.003 p = 0.010 PMd PPA FFA den Ouden et al. 2010, J. Neurosci .
Outline • Bayesianmodelselection (BMS) • Embedding computationalmodels in DCMs • IntegratingtractographyandDCM • Stochastic DCM
Diffusion-tensor imaging Sporns, Scholarpedia Parker & Alexander, 2005, Phil. Trans. B
Probabilistictractography: Kaden et al. 2007, NeuroImage • computes local fibre orientation density by deconvolution of the diffusion-weighted signal • estimates the spatial probability distribution of connectivity from given seed regions • anatomical connectivity = proportion of fibre pathways originating in a specific source region that intersect a target region • Asymmetry in metric accounted for by taking average of seed and target regions when interchanged
Integration of tractography and DCM R1 R2 low probability of anatomical connection small prior variance of effective connectivity parameter R1 R2 Stephan, Tittgemeyer et al. 2009, NeuroImage high probability of anatomical connection large prior variance of effective connectivity parameter
probabilistic tractography FG right LG right anatomical connectivity LG left LG (x1) FG (x4) FG (x3) LG (x2) FG left LD|LVF φ34 = 6.5% φ24 = 43.6% LD LD φ13 = 15.7% φ12 = 34.2% DCM structure LD|RVF BVF stim. RVF stim. LVF stim. φ34 = 6.5% Hypothesisedconnection-specific priors for coupling parameters Stephan, Tittgemeyer et al. 2009, NeuroImage φ34 = 43.6%
m5: a=-12,b=-28 m6: a=-12,b=-24 m7: a=-12,b=-20 m8: a=-8,b=-32 m9: a=-8,b=-28 1 1 1 1 1 0.5 0.5 0.5 0.5 0.5 0 0 0 0 0 0 0.5 1 0 0.5 1 0 0.5 1 0 0.5 1 0 0.5 1 m10: a=-8,b=-24 m11: a=-8,b=-20 m12: a=-8,b=-16 m13: a=-8,b=-12 m14: a=-4,b=-32 m15: a=-4,b=-28 m16: a=-4,b=-24 m17: a=-4,b=-20 m18: a=-4,b=-16 1 1 1 1 1 1 1 1 1 0.5 0.5 0.5 0.5 0.5 0.5 0.5 0.5 0.5 0 0 0 0 0 0 0 0 0 0 0.5 1 0 0.5 1 0 0.5 1 0 0.5 1 0 0.5 1 0 0.5 1 0 0.5 1 0 0.5 1 0 0.5 1 m19: a=-4,b=-12 m20: a=-4,b=-8 m21: a=-4,b=-4 m22: a=-4,b=0 m23: a=-4,b=4 m24: a=0,b=-32 m25: a=0,b=-28 m26: a=0,b=-24 m27: a=0,b=-20 1 1 1 1 1 1 1 1 1 0.5 0.5 0.5 0.5 0.5 0.5 0.5 0.5 0.5 0 0 0 0 0 0 0 0 0 0 0.5 1 0 0.5 1 0 0.5 1 0 0.5 1 0 0.5 1 0 0.5 1 0 0.5 1 0 0.5 1 0 0.5 1 m28: a=0,b=-16 m29: a=0,b=-12 m30: a=0,b=-8 m31: a=0,b=-4 m32: a=0,b=0 m33: a=0,b=4 m34: a=0,b=8 m35: a=0,b=12 m36: a=0,b=16 1 1 1 1 1 1 1 1 1 0.5 0.5 0.5 0.5 0.5 0.5 0.5 0.5 0.5 0 0 0 0 0 0 0 0 0 0 0.5 1 0 0.5 1 0 0.5 1 0 0.5 1 0 0.5 1 0 0.5 1 0 0.5 1 0 0.5 1 0 0.5 1 m37: a=0,b=20 m38: a=0,b=24 m39: a=0,b=28 m40: a=0,b=32 m41: a=4,b=-32 1 1 1 1 1 1 0.5 0.5 0.5 0.5 0.5 0.5 0 0 0 0 0 0 0 0.5 1 0 0.5 1 0 0.5 1 0 0.5 1 0 0.5 1 0 0.5 1 m46: a=4,b=16 m47: a=4,b=20 m48: a=4,b=24 m49: a=4,b=28 m50: a=4,b=32 m51: a=8,b=12 m52: a=8,b=16 m53: a=8,b=20 m54: a=8,b=24 1 1 1 1 1 1 1 1 0.5 0.5 0.5 0.5 0.5 0.5 0.5 0.5 0 0 0 0 0 0 0 0 0 0.5 1 0 0.5 1 0 0.5 1 0 0.5 1 0 0.5 1 0 0.5 1 0 0.5 1 0 0.5 1 m55: a=8,b=28 m56: a=8,b=32 m57: a=12,b=20 m58: a=12,b=24 m59: a=12,b=28 m60: a=12,b=32 m61: a=16,b=28 m62: a=16,b=32 1 1 1 1 1 1 1 1 0.5 0.5 0.5 0.5 0.5 0.5 0.5 0.5 0.5 0 0 0 0 0 0 0 0 0 0 0.5 1 0 0.5 1 0 0.5 1 0 0.5 1 0 0.5 1 0 0.5 1 0 0.5 1 0 0.5 1 0 0.5 1 Connection-specific prior variance as a function of anatomical connection probability m1: a=-32,b=-32 m2: a=-16,b=-32 m3: a=-16,b=-28 m4: a=-12,b=-32 1 1 1 1 0.5 0.5 0.5 0.5 0 0 0 0 0 0.5 1 0 0.5 1 0 0.5 1 0 0.5 1 • 64 different mappings by systematic search across hyper-parameters and • yields anatomically informed (intuitiveand counterintuitive) and uninformed priors m42: a=4,b=0 m43: a=4,b=4 m44: a=4,b=8 m45: a=4,b=12 1 1 1 0.5 0.5 0.5 0 0 0 0 0.5 1 0 0.5 1 0 0.5 1 1 0.5 0 0 0.5 1 m63 & m64 1
m1: a=-32,b=-32 m2: a=-16,b=-32 m3: a=-16,b=-28 m4: a=-12,b=-32 m5: a=-12,b=-28 m6: a=-12,b=-24 m7: a=-12,b=-20 m8: a=-8,b=-32 m9: a=-8,b=-28 1 1 1 1 1 1 1 1 1 0.5 0.5 0.5 0.5 0.5 0.5 0.5 0.5 0.5 0 0 0 0 0 0 0 0 0 0 0.5 1 0 0.5 1 0 0.5 1 0 0.5 1 0 0.5 1 0 0.5 1 0 0.5 1 0 0.5 1 0 0.5 1 m10: a=-8,b=-24 m11: a=-8,b=-20 m12: a=-8,b=-16 m13: a=-8,b=-12 m14: a=-4,b=-32 m15: a=-4,b=-28 m16: a=-4,b=-24 m17: a=-4,b=-20 m18: a=-4,b=-16 1 1 1 1 1 1 1 1 1 0.5 0.5 0.5 0.5 0.5 0.5 0.5 0.5 0.5 0 0 0 0 0 0 0 0 0 0 0.5 1 0 0.5 1 0 0.5 1 0 0.5 1 0 0.5 1 0 0.5 1 0 0.5 1 0 0.5 1 0 0.5 1 m19: a=-4,b=-12 m20: a=-4,b=-8 m21: a=-4,b=-4 m22: a=-4,b=0 m23: a=-4,b=4 m24: a=0,b=-32 m25: a=0,b=-28 m26: a=0,b=-24 m27: a=0,b=-20 1 1 1 1 1 1 1 1 1 0.5 0.5 0.5 0.5 0.5 0.5 0.5 0.5 0.5 0 0 0 0 0 0 0 0 0 0 0.5 1 0 0.5 1 0 0.5 1 0 0.5 1 0 0.5 1 0 0.5 1 0 0.5 1 0 0.5 1 0 0.5 1 m28: a=0,b=-16 m29: a=0,b=-12 m30: a=0,b=-8 m31: a=0,b=-4 m32: a=0,b=0 m33: a=0,b=4 m34: a=0,b=8 m35: a=0,b=12 m36: a=0,b=16 1 1 1 1 1 1 1 1 1 0.5 0.5 0.5 0.5 0.5 0.5 0.5 0.5 0.5 0 0 0 0 0 0 0 0 0 0 0.5 1 0 0.5 1 0 0.5 1 0 0.5 1 0 0.5 1 0 0.5 1 0 0.5 1 0 0.5 1 0 0.5 1 m37: a=0,b=20 m38: a=0,b=24 m39: a=0,b=28 m40: a=0,b=32 m41: a=4,b=-32 1 1 1 1 1 1 0.5 0.5 0.5 0.5 0.5 0.5 0 0 0 0 0 0 0 0.5 1 0 0.5 1 0 0.5 1 0 0.5 1 0 0.5 1 0 0.5 1 m46: a=4,b=16 m47: a=4,b=20 m48: a=4,b=24 m49: a=4,b=28 m50: a=4,b=32 m51: a=8,b=12 m52: a=8,b=16 m53: a=8,b=20 m54: a=8,b=24 1 1 1 1 1 1 1 1 0.5 0.5 0.5 0.5 0.5 0.5 0.5 0.5 0 0 0 0 0 0 0 0 0 0.5 1 0 0.5 1 0 0.5 1 0 0.5 1 0 0.5 1 0 0.5 1 0 0.5 1 0 0.5 1 m55: a=8,b=28 m56: a=8,b=32 m57: a=12,b=20 m58: a=12,b=24 m59: a=12,b=28 m60: a=12,b=32 m61: a=16,b=28 m62: a=16,b=32 1 1 1 1 1 1 1 1 0.5 0.5 0.5 0.5 0.5 0.5 0.5 0.5 0.5 0 0 0 0 0 0 0 0 0 0 0.5 1 0 0.5 1 0 0.5 1 0 0.5 1 0 0.5 1 0 0.5 1 0 0.5 1 0 0.5 1 0 0.5 1 m42: a=4,b=0 m43: a=4,b=4 m44: a=4,b=8 m45: a=4,b=12 1 1 1 0.5 0.5 0.5 0 0 0 0 0.5 1 0 0.5 1 0 0.5 1 1 0.5 0 0 0.5 1 m63 & m64 1 Stephan, Tittgemeyer et al. 2009, NeuroImage
Outline • Bayesianmodelselection (BMS) • Embedding computationalmodels in DCMs • IntegratingtractographyandDCM • Stochastic DCM
Stochastic DCM A(2,2) A(2,1) A(1,2) x1 A(1,1) u1
Stochastic DCM • accounts for stochastic neural fluctuations • can be fitted to resting state data • has unknown precision and smoothness additional hyperparameters • Inversion: Generalised filtering (under the Laplace assumption) Li et al. (2011) NeuroImage Friston et al. (2008, 2011) NeuroImage Daunizeau et al. (2009) Physica D
Deterministic DCM y y H{2} x2 H{1} A(2,2) A(2,1) u1 B(1,2) A(1,2) x1 u2 C(1) A(1,1)
Deterministic DCM y y H{2} x2 H{2} A(2,2) A(2,1) u1 B(1,2) A(1,2) x1 u2 C(1) A(1,1)
Stochastic DCM y y H{2} x2 H{2} A(2,2) A(2,1) B(1,2) A(1,2) x1 u2 A(1,1) u1
Experiment 2 Learning Task in Parkinson’s Patients on and off Levopdopa Acquisition Performance Learning best of 2 stimuli Generalisation of stimuli values in novel context In the scanner In the scanner Shiner et al, in press, Brain
Experiment 2 Value in the vmPFC • Parkinsonian Cohort, n=11 • Activity in vmPFC correlated with learned predictive outcome • (% correct/”value”) on and off levodopa • Extract VOIs from both sessions vmPFC: global max Shiner et al, in press, Brain
DCMs Off L-Dopa On L-Dopa BOLD BOLD пy пy H{2} H{2} x: vmPFC x: vmPFC пx пx A(1,1) A(1,1) пv пv U: Value U: Value