Download

1 / 30
300 likes | 593 Views
Direct Variation. What is it and how do I know when I see it?. Definition. Direct Variation – a special type of linear relationship that can represented by a function in the form y = kx , Constant of Variation – is k , the coefficient of x , in the function y = kx.

E N D
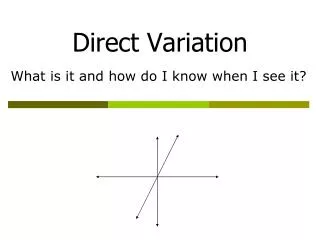
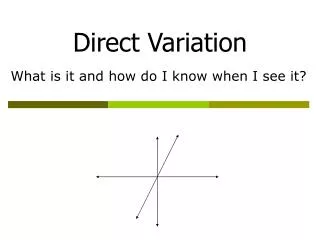
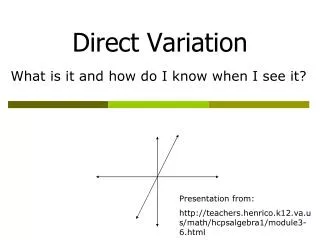
Direct Variation What is it and how do I know when I see it?
Definition • Direct Variation – a special type of linear relationship that can represented by a function in the form y = kx, • Constant of Variation – is k, the coefficient of x, in the function y = kx.
Direct Variation A recipe for paella calls for 1 cup of rice to make 5 servings. In other words, a chef needs 1 cup of rice for every 5 servings. The equation y = 5x describes this relationship. In this relationship, the number of servings varies directly with the number of cups of rice.
So, in a direct variation, the ratio is equal to the constant of variation. Determine Direct Variation from a Table What happens if you solve y = kx for k? y = kx Divide both sides by x (x ≠ 0).
This is a direct variation because is the same for each ordered pair. Example: Determine Direct Variation from a Table Tell whether the relationship is a direct variation. Explain. Find for each ordered pair.
Examples of Direct Variation: What is the constant of variation of the table above? Since y = kx we can say Therefore: 12/6=k or k = 2 14/7=k or k = 2 16/8=k or k =2 Note k stays constant. y = 2x is the equation!
Examples of Direct Variation: What is the constant of variation of the table above? Since y = kx we can say Therefore: 30/10=k or k = 3 15/5=k or k = 3 9/3=k or k =3 Note k stays constant. y = 3x is the equation!
Answer Now What is the constant of variation for the following direct variation? • 2 • -2 • -½ • ½
Is this a direct variation? If yes, give the constant of variation (k) and the equation. No! The k values are different!
Answer Now Which is the equation that describes the following table of values? • y = -2x • y = 2x • y = ½ x • xy = 200
We can find the constant of proportionality from a table of values, equation and a graph. In a table, simplify any one of the ratios.
Example: Find the constant of proportionality:
Using Direct Variation to find unknowns (y = kx) Given that y varies directly with x, and y = 28 when x=7, Find x when y = 52. HOW??? 2 step process 1. Find the constant variation k = y/x or k = 28/7 = 4 k=4 2. Use y = kx. Find the unknown (x). 52= 4x or 52/4 = x x= 13 Therefore: X =13 when Y=52
We can find the constant of proportionality from a table of values, equation and a graph. In a table, simplify any one of the ratios.
Joke Time • How would you describe a frog with a broken leg? • Unhoppy • What did the horse say when he got to the bottom of his feed bag? • That’s the last straw! • What kind of music do chiropractors listen to? • Hip - Pop
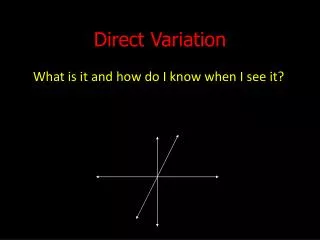
A Graph is a direct variation if: It is a straight line that passes through the origin (0,0)
Tell if the following graph is a Direct Variation or not. Yes No No No
Tell if the following graph is a Direct Variation or not. Yes No No Yes
Is the relationship shown in the graph proportional? 41 50 Yes 45 No 40 Salary ($) 35 30 25 20 15 10 5 0 1 2 3 4 5 6 7 8 9 10 Hours
42 Is the relationship shown in the graph proportional? Yes No 50 45 Cost ($) 40 35 30 25 20 15 10 5 0 1 2 3 4 5 6 7 8 9 10 Toppings
43 Is the relationship shown in the graph proportional? 5 4.5 Yes 4 No Seconds 3.5 3 2.5 2 1.5 1 0.5 0 1 2 3 4 5 6 7 8 9 10 Feet
44 Is the relationship shown in the graph proportional? 50 45 Yes No 40 Cost ($) 35 30 25 20 15 10 5 0 1 2 3 4 5 6 7 8 9 10 Text Messages
Constant of Proportionality The graph of a proportional relationship is a straight line that passes through the origin. Proportional quantities can be described by the equation y= kx, where k is a constant ratio.
Constant of Proportionality Equation for constant of proportionality is y = kx We can tell that the relationship is directly proportional by looking at the graph. The graph is a straight line that passes through the origin.
Constant of Proportionality Equation for constant of proportionality is y = kx Create a table using the points from the graph:
Constant of Proportionality Equation for constant of proportionality is y = kx Create a table using the points from the graph:
In a graph, choose a point (x, y) to find and simplify the ratio. (2,24) 60 54 48 42 Students 36 30 24 18 12 6 0 1 2 3 4 5 6 7 8 9 10 Chaperones