Download
1 / 51
590 likes | 1.02k Views
Fisheries Management. Renewable and Nonrenewable Resources Maximum Sustainable Yield A. Schaefer Model B. Beverton-Holt Model Resource Limited Population Practical and Theoretical Problems. Renewable and Nonrenewable Resources. Geological Resources are Nonrenewable Biological Resources

E N D
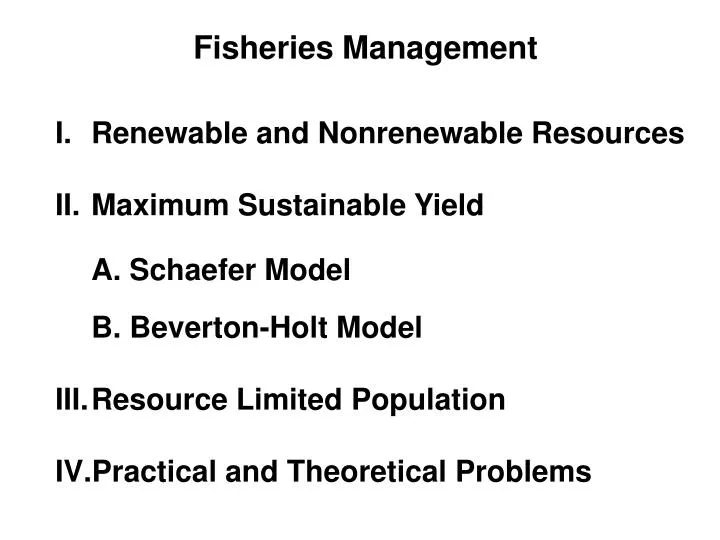
Fisheries Management Renewable and Nonrenewable Resources Maximum Sustainable Yield A. Schaefer Model B. Beverton-Holt Model Resource Limited Population Practical and Theoretical Problems
Renewable and Nonrenewable Resources Geological Resources are Nonrenewable Biological Resources A. If managed properly, they can be Renewable B. If managed improperly, they become Nonrenewable
Renewable and Nonrenewable Resources Copper Petroleum Soils Dodo
Maximum Sustainable Yield Schaefer Model Relates Fish Catch to Fishing Effort Beverton-Holt Model Relates Fish Catch to Fish Population Dynamics
Maximum Sustainable Yield Development of the Concept
“It took fisheries scientists until the 1930s to prove scientifically that the Victorian scientist T.S. Huxley had been incorrect when he said that the great sea fishes were inexhaustible and that it was futile to try to regulate the great fisheries.” You do not PROVE something scientifically. In hindsight, Huxley could have done better. By the Victorian Era, the Right and Grey Whales had already been wiped out in the North Atlantic. In any case, by mid-century, some people realized that a science-based management of fisheries was necessary.
Maximum Sustainable Yield: Assumptions Used in its Development Oceanic Ecosystems are Infinitely Resilient It Will be Possible to Accurately Determine Critical Parameters of Fish Populations III. If a Fish Stock is Overharvested, Fishing Pressure Will Be Reduced
Maximum Sustainable Yield: Political Context Within Which it Developed Post-War American Domination of the Seas Economic Activities Don’t Require Regulation
Maximum Sustainable Yield Schaefer Model Relates Fish Catch to Fishing Effort Beverton-Holt Model Relates Fish Catch to Fish Population Dynamics
Schaefer Model Underfishing Overfishing (hours)
Schaefer Model Overfishing Underfishing (pounds/hour)
Beverton-Holt Model Schaefer Model Schaefer Model F
Beverton-Holt Model: Application to a Resource-Limited Population Mortality declines with fishing because: Caught fish don’t die a natural death; A fished population is a younger population, with a lower death rate; Individuals in a fished population have access to more resources, so they are healthier and have a lower death rate. F
Beverton-Holt Model: Application to a Resource-Limited Population Gross Production declines with fishing less rapidly than M declines because: Individuals in a fished population have access to more resources, so they grow faster and have higher fecundity. F
Practical and Theoretical Problems • Practical Problems Determination of Population Parameters (Beverton-Holt Model) Determination of Fishing Effort (Schaeffer Model)
OTOLITHS: Information that can be obtained from the analysis of otolith biomineralization patterns Age
OTOLITHS: Information that can be obtained from the analysis of otolith biomineralization patterns Age Spawn Date Hatch Date Metamorphosis Growth History
For Those Who May Be Interested: More information on otoliths can be found at http://www.marinebiodiversity.ca/ otolith/english/daily.html
Population Size: Estimate by Tagging 18,055 herring tagged and released Subsequent to release, 810,000 fish surveyed 13 tags recovered (13/810,000) = (18,055/1.12x109) Population size estimated at 1.12x10⁹ herring
Determination of Fishing Effort • Units used to measure effort must be defined • Type of fish-finding technology and fish-harvesting technology must be taken into account III. “I fish, therefore I lie” must be factored in
Theoretical Problems Variable Recruitment K and r Selection Stock Stability Effects of Competitors Recruitment - Reproduction Time Lag
Percentage contribution of year classes of Norwegian spring spawn herring to the adult stock from 1954 through 1962. The very good year class of 1950 began first appearing in significant numbers in 1954 and dominated the adult stock throughout this period.
Mathematical Modeling of Population Dynamics: The Logistic Equation and r-selected and K-selected populations
Thomas Malthus: Unlimited Growth Unlimited Population Growth Based on the Exponential Equation
Thomas Malthus: Unlimited Growth Unlimited Population Growth Based on the Exponential Equation
Pierre Francois Verhulst: Limited Growth Limited Population Growth Based on the Logistic Equation
The Logistic Equation rate of change =
The Logistic Equation rate of change = N = Population Size R = Reproductive Capacity of the Species K = Carrying Capacity of the Ecosystem
Pierre Francois Verhulst: Limited Growth Limited Population Growth Based on the Logistic Equation
Pierre Francois Verhulst: Limited Growth Multiple “Steady States” Possible with the Logistic Equation Multiple “Steady States” Possible with the Logistic Equation
r-selected species K-selected species
r-selected species K-selected species
Stock Stability Fishing at 15% of MSY Fishing at 75% of MSY Fishing at 100% of MSY
Strategic Issues Economics Maximizing Yield How to Deal with Catch Variability
How to Deal with Catch Variability The Canadian Cod Example: Fished to Commercial Extinction Before Establishment of a Moratorium: No Recovery of the Stock, No Recovery of the Fishery The Norwegian Cod Example: Moratorium Established in Response to Declining Catch: Stock Recovered, as did a Viable Fishery
HOW MANY FISH SHOULD WE CATCH? Given the uncertainties involved in estimating the maximum sustainable yield; and Given that the economics of attaining the maximum Sustainable yield don’t make sense; and Given that harvesting the maximum sustainable yield makes the population especially prone to collapse;
Stock Stability Fishing at 15% of MSY Fishing at 75% of MSY Fishing at 100% of MSY
HOW MANY FISH SHOULD WE CATCH? SUBSTANTIALLY LESS THAN THE MAXIMUM SUSTAINABLE YIELD!
Stock Stability Fishing at 15% of MSY Fishing at 75% of MSY Fishing at 100% of MSY