Download
1 / 38
380 likes | 403 Views
Section 2.1. Frequency Distributions. Objectives. Construct a frequency distribution. Frequency Distributions. A distribution is a way to describe the structure of a particular data set or population.

E N D
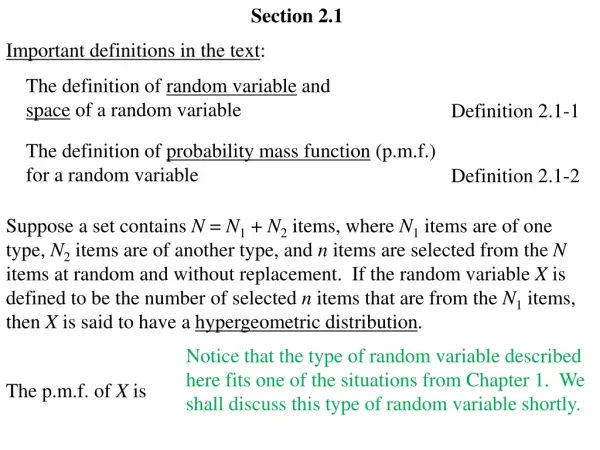
Section 2.1 Frequency Distributions
Objectives Construct a frequency distribution
Frequency Distributions A distribution is a way to describe the structure of a particular data set or population. A frequency distribution is a display of the values that occur in a data set and how often each value, or range of values, occurs. Frequencies(f) are the numbers of data values in the categories of a frequency distribution. A class is a category of data in a frequency distribution.
Frequency Distributions An ordered array is an ordered list of the data from largest to smallest or vice versa. A probability distribution is a theoretical distribution used to predict the probabilities of particular data values occurring in a population. An ungrouped frequency distributionis a frequency distribution where each category or class represents a single value. A grouped frequency distributionis a frequency distribution where the classes are ranges of possible values.
Constructing a Frequency Distribution Constructing a Frequency Distribution 1.Decide how many classes should be in the distribution. There are typically between 5 and 20 classes in a frequency distribution. Several different methods can be used to determine the number of classes that will show the data most clearly, but in this textbook, the number of classes for a given data set will be suggested.
Frequency Distributions Constructing a Frequency Distribution (cont.) 2.Choose an appropriate class width. In some cases, the data set easily lends itself to natural divisions, such as decades or years. At other times, we must choose divisions for ourselves. When starting a frequency distribution from scratch, one method of finding an appropriate class width is to begin by subtracting the lowest number in the data set from the highest number in the data set and dividing the difference by the number of classes.
Frequency Distributions Constructing a Frequency Distribution (cont.) Rounding this number up gives a good starting point from which to choose the class width. You will want to choose a width so that the classes formed present a clear representation of the data and include all members of the data set, so make a sensible choice.
Frequency Distributions Constructing a Frequency Distribution (cont.) 3.Find the class limits. The lower class limit is the smallest number that can belong to a particular class, and the upper class limit is the largest number that can belong to a class. Using the minimum data value, or a smaller number, as the lower limit of the first class is a good place to begin. However, judgment is required. You should choose the first lower limit so that reasonable classes will be produced, and it should have the same number of decimal places as the largest number of decimal places in the data.
Frequency Distributions Constructing a Frequency Distribution (cont.) After choosing the lower limit of the first class, add the class width to it to find the lower limit of the second class. Continue this pattern until you have the desired number of lower class limits. The upper limit of each class is determined such that the classes do not overlap. If, after creating your classes, there are any data values that fall outside the class limits, you must adjust either the class width or the choice for the first lower class limit.
Frequency Distributions Constructing a Frequency Distribution (cont.) 4.Determine the frequency of each class. Make a tally mark for each data value in the appropriate class. Count the marks to find the total frequency for each class.
Frequency Distributions Class width The class width is the difference between the lower limits or upper limits of two consecutive classes of a frequency distribution. The lower class limit is the smallest number that can belong to a particular class. The upper class limit is the largest number that can belong to a particular class.
Example 2.1: Constructing a Frequency Distribution Create a frequency distribution using five classes for the list of 3-D TV prices given in Table 2.2.
Example 2.1: Constructing a Frequency Distribution (cont.) Solution Because we were told how many classes to include, we will begin by deciding on a class width. Subtract the lowest data value from the highest and divide by the number of classes, as shown below. This would give us a class width of $81.
Example 2.1: Constructing a Frequency Distribution (cont.) We will stop here and consider some options. Choosing a class width of $81 does seem perfectly reasonable from a theoretical point of view. However, one should consider the impression created by having TV prices grouped in intervals of $81. Can you imagine presenting this data to a client? Instead, it would be more reasonable to group TV prices by intervals of $100. Therefore, we will choose our class width to be $100.
Example 2.1: Constructing a Frequency Distribution (cont.) Next, we need to choose a starting point for the classes, that is, the first lower class limit. One should always first consider using the smallest data value for the beginning point. In this case, if we choose the smallest TV price, we would be starting the first class at $1595 with a width of $100. However, given that we’ve chosen a class width of $100, it is more natural to begin the first class at $1500.
Example 2.1: Constructing a Frequency Distribution (cont.) Now let’s continue building the class limits. Adding the class width of $100 to $1500, we obtain a second lower class limit of $1600. The next lower limit is found by adding $100 to $1600. We continue in this fashion until we have five lower class limits, one for each of our five classes. Finally, we need to determine appropriate upper class limits. Again, be reasonable. Remember, too, that the classes are not allowed to overlap.
Example 2.1: Constructing a Frequency Distribution (cont.) Because the data are in whole dollar amounts, it makes sense to choose upper class limits that are one dollar less than the next lower limit. The classes we have come up with are as follows.
Example 2.1: Constructing a Frequency Distribution (cont.) Note that the last upper class limit is also the maximum value in the data set. This will not necessarily occur in every frequency table. However, we have included all the data values in our range of classes, so no adjustments to the classes are necessary. Tabulating the number of data values that occur in each class produces the following frequency table.
Example 2.1: Constructing a Frequency Distribution (cont.) Note that the sum of the frequency column should equal the number of data values in the set. Check for yourself that this is true.
Characteristics of a Frequency Distribution Class boundary A class boundary is the value that lies halfway between the upper limit of one class and the lower limit of the next class. After finding one class boundary, add (or subtract) the class width to find the next class boundary. The boundaries of a class are typically given in interval form: lower boundary–upper boundary.
Example 2.2: Calculating Class Boundaries Calculate the class boundaries for each class in the frequency distribution from Example 2.1. Solution Look at the first and second classes. The upper limit of class one is 1599. The lower limit of class two is 1600. Thus, the class boundary between the first two classes is calculated as follows.
Example 2.2: Calculating Class Boundaries (cont.) Recall that the class width is 100. Adding 100 to 1599.5 gives the next class boundary. You can repeat this step to find the remaining class boundaries.
Characteristics of a Frequency Distribution Class Midpoint The class midpoints are often used for estimating the average value in each class.
Example 2.3: Calculating Class Midpoints Calculate the midpoint of each class in the frequency distribution from Example 2.1. Solution The midpoint is the sum of the class limits divided by two. For the first class, the midpoint is calculated as follows.
Example 2.3: Calculating Class Midpoints (cont.) We can use this same calculation to find the midpoints of the remaining classes. Another method is to add 100 (the class width) to the first midpoint, as we did with class boundaries.
Characteristics of a Frequency Distribution Relative Frequency The relative frequency is the fraction or percentage of the data set that falls into a particular class, given by where f is the class frequency, n is the samplesize, given by and is the frequency of the class.
Example 2.4: Calculating Relative Frequencies Calculate the relative frequency for each class in the frequency distribution from Example 2.1. Solution We first find the sample size by summing the class frequencies. Then divide each class frequency by 20.
Characteristics of a Frequency Distribution Cumulative Frequency The cumulative frequency is the sum of the frequencies of a given class and all previous classes. The cumulative frequency of the last class equals the sample size.
Example 2.5: Calculating Cumulative Frequencies Calculate the cumulative frequency for each class in the frequency distribution from Example 2.1. Solution
Example 2.6: Characteristics of a Frequency Distribution Data collected on the numbers of miles that professors drive to work daily are listed below. Use these data to create a frequency distribution that includes the class boundaries, midpoint, relative frequency, and cumulative frequency of each class. Use six classes. Be sure that your class limits have the same number of decimal places as the largest number of decimal places in the data.
Example 2.6: Characteristics of a Frequency Distribution (cont.) Solution Since this example calls for six classes, a good starting point for the class width is calculated as follows.
Example 2.6: Characteristics of a Frequency Distribution (cont.) Because our data are in miles, a more sensible class width to use is 2. Next, to choose the lower class limit of the first class, begin by considering the smallest data value, which is 1 mile. In this case, 1.0 is a reasonable place to begin our classes. Adding the class width of 2 gives us the following table.
Example 2.6: Characteristics of a Frequency Distribution (cont.) Once again, note that all of the data values fall within the range of the class limits. So, no adjustments in the classes are necessary.
Example 2.6: Characteristics of a Frequency Distribution (cont.) The upper class boundary and midpoint of the first class are calculated as follows. Use the class width to find the other class boundaries and midpoints. The frequency, relative frequency, and cumulative frequency of each class are calculated as in previous examples.
Example 2.6: Characteristics of a Frequency Distribution (cont.)
Overview: Constructing a Frequency Distribution Decide on the number of classes • Between 5 and 20 Choose an appropriate class width Find the class limits • Start with the lowest data value, or a smaller number, and add the class width to get the next class limit. Determine the frequency of each class • Count the number of data values in each class.
Overview: Other Characteristics Classes boundaries • Split the difference in the gap between the upper limit of one class and the lower limit of the next class. Midpoints Relative Frequency Cumulative Frequency • The sum of the frequency for a given class and all previous classes.