Download

1 / 29
290 likes | 300 Views
Industrialization, Urbanization, and Immigration. 1865-1924. Industrial Growth. Between 1865 and 1900, the u.s. experienced unprecedented economic growth 1860 manufacturers had about $2 billion in value by 1900 they had over $11 billion

E N D
Industrial Growth • Between 1865 and 1900, the u.s. experienced unprecedented economic growth • 1860 manufacturers had about $2 billion in value by 1900 they had over $11 billion • Iron ore production nearly quadrupled from 7 million long-tons to 27 million long-tons • Steel output rose from less than 1 million tons to over 11 million tons • GNP tripled during that time • Railroad mileage increased from 30,000 to 250,000 miles
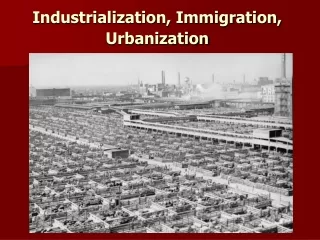
Rise of Big Business • By 1900 the American economy was dominated by business monopolies or trusts, huge business empires that virtually controlled key sectors of the economy and dominated social and political life • Trusts in sugar, cotton, tobacco, meat, flour, and even whiskey • Number of industrial combinations rose from 12 to 305 between 1887 and 1903 • 2,600 smaller firms disappeared • By 1900, 1 % of all companies produced 40% of the manufacturing output • GAPE saw the rise of the modern corporation • Used 14th Amendment to gain “personhood” and rights
Immigration Statistics • 1860-1920 -- aprox. 30 million European immigrants • 1880-1920 -- appox. 27 million European immigrants • 2 “Waves” of immigrants • 1860-1890 – “Old” Imm (approx. 10mil) Britain, Ireland, Germany, Scandinavia, Switzerland, Holland, France, Spain • 1890-1920 – “New” Imm (approx. 20mil) Italy, Greece, Austro-Hungary, Russia, Romania, Turkey
Immigration Statistics • Compare 1882 and 1907 • 1882 -- peak of “old” immigration • 788,992 total immigrants • 250,630 - German (highest ever) • 179,423 - Britain and Ireland • 105,326 - Scandinavia • 32,159 - Italy • 29,150 - Hapsburg Empire • 16,918 - Russia and Baltic States • 87% from NW Europe and 13% from southern and eastern Europe
Immigration Statistics • 1907 -- peak of “new” immigration • 1,285,349 total immigrants • 19.3% from NW Europe • 80.7% from S&E Europe • Although migration from NW Europe continued throughout the GAPE by 1890s so-called “new” immigrants dominated immigration statistics
What Did They Know About the U.S.? • Heard of opportunities for employment through: • “travelers’ tales” • Advertisements • Guidebooks • Pamphlets and Newspapers • Where to Emigrate and Why • Informed migrants on where, why, and how to go • After 1867 virtually all migrants came over on steamships • Cheaper and faster • By 1880s primarily British and German steamers
Where did they go? • No area of the U.S. completely escaped immigration (Butte Irish) • But “new” immigrants were decidedly urban and mostly in northeast and upper Midwest • 80% of immigrants settled in places like NYC and Chicago -- New England, New York, Illinois, Michigan, Missouri, Iowa, Wisconsin, Ohio proved especially attractive, because of jobs, transportation, and support network (explain). • 1890 - 56% of industrial laborers were foreign born or children of foreign born
Support Network • Ethnic neighborhoods or “ghettos” • Mutual aid societies • Native language businesses and newspapers • Job networks • Churches and synagogues • In some cases (Irish) local political machine
Chinese Immigrants • By 1870, 26% of California’s Chinese population lived in San Francisco and represented 46% of the labor force in SF four key industries; boot and shoe making, woolen cloth, cigar and tobacco manufacture, and sewing. • By 1880, Chinese comprised 52% boot and shoe. 44% brick makers, 85% cigar makers, 33% of woolen mill operators.
Chinese Exclusion • In 1882, Congress passed the Chinese Exclusion Act, which made it unlawful for Chinese laborers to enter the country and declared Chinese already living in the United States ineligible for U.S. citizenship. (10 yrs) • Renewed in 1892 (10 yrs) • Made permanent in 1902 • Remained in effect until 1943
End of “New” Immigration • Immigration declined significantly after 1914 • World War I • “New” Immigration ended almost completely in 1924 • Congress passed the National Origins Act or Immigration Restriction Act • Limited number of entrants to 2% of 1890 census