1 / 10

How to easily create a bar-graph for age-gender specific incidence rates per 1000 person-years in SPSS from individual d

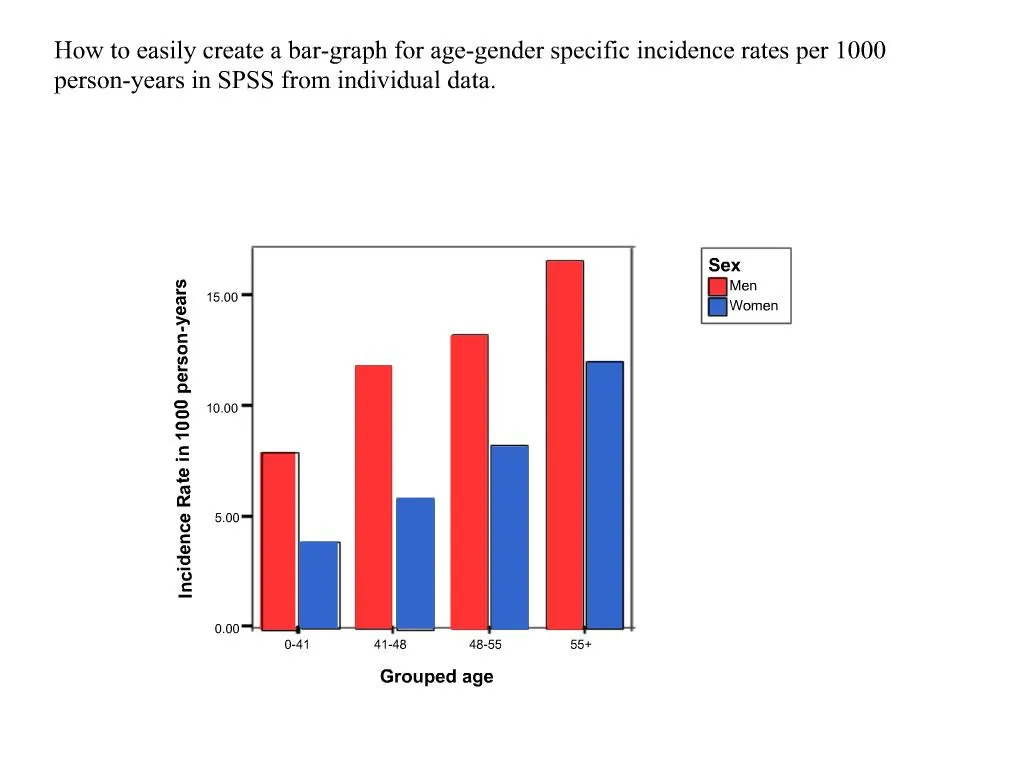
In order to create a bar graph for age-sex specific incidence rates, we need to: 1. Create aggregated data on: (A) Total number of incidence events in each age-sex category. (B). Total number of follow-up time in each age-sex category.2. Compute incidence rate in

christine
Download Presentation

How to easily create a bar-graph for age-gender specific incidence rates per 1000 person-years in SPSS from individual d

An Image/Link below is provided (as is) to download presentation Download Policy: Content on the Website is provided to you AS IS for your information and personal use and may not be sold / licensed / shared on other websites without getting consent from its author. Content is provided to you AS IS for your information and personal use only. Download presentation by click this link. While downloading, if for some reason you are not able to download a presentation, the publisher may have deleted the file from their server. During download, if you can't get a presentation, the file might be deleted by the publisher.

E N D

Presentation Transcript


    More Related