Download
1 / 18
180 likes | 191 Views
This study examines the potential transfer of traffic from existing transport modes to personal air transport in Europe by 2020 using the Generalised Cost method. It analyzes connections, transport modes, data collection, business traffic, top connections between countries, fleet estimates in France and Poland, and presents a sensitivity analysis. The conclusion shows the potential demand for personalized transport services and the need for high-speed transport in remote areas, with a projected transfer of 3% of total European traffic to personal air transport by 2020.

E N D
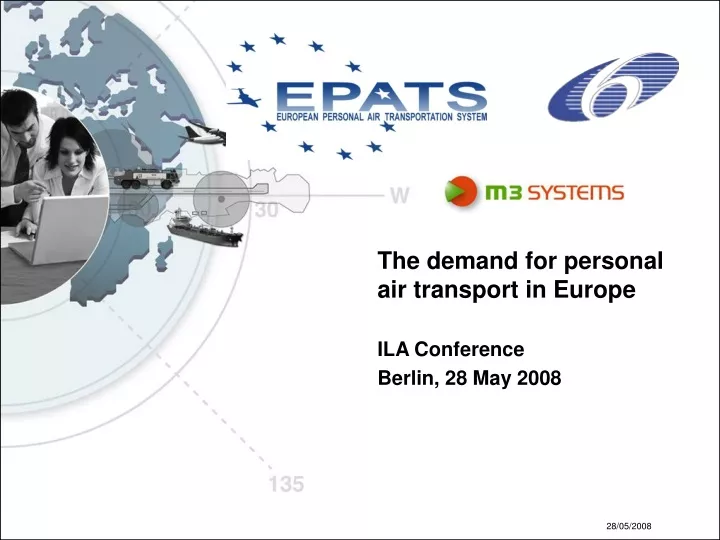
The demand for personal air transport in Europe • ILA Conference • Berlin, 28 May 2008
Which potential transfer of traffic from existing transport modes to personal air transport in 2020?
Method • Estimation Method • Generalised Cost method including: • The direct cost borne by the traveller • The travel time and its associated cost value • A traveller will choose the transport mode that minimizes his/her generalised cost
Connections • Potential connections • 63 429 total regional connections in Europe • 15223 potential connections for Personal air transport • (=24% of the total connections)
Transport modes • Transport modes • EPATS generalised cost for traveller compared with the corresponding gesneralised costs of • Road transport • Traditional air transport • High speed rail transport • High-speed rail not kept since always preferred to EPATS
Data collection • Data collection • Sources: • Various databases from previous EU projects: DATELINE, TREMOVE, ASSESS, etc. • EUROSTAT • National statistics organisms • Etc. • 2020 scenarios: • ASSESS scenarios (Assessment of the contribution of the TEN and other transport policy measures to the mid-term implementation of the White Paper on the European Transport Policy for 2010)
152 billions passengers kilometres 319 millions passengers 100% Business traffic Traffic • 2020 European Personal Air Traffic 2020 European people: wealthier and more mobile
44 Million Flights 43 Million Flights 2020 Flights
2020 Flights • TOP 10 connections between countries • France-Spain • Portugal-Spain • Italy-France • United-Kingdom-Ireland • Poland-Germany • United-Kingdom-France • Italy-Spain • Italy-Austria • France-Germany • Italy-Greece
2020 Fleet • 90 000 personal aircraft in Europe
France • EPATS traffic and fleet in France • 302 French domestic EPATS connections • Estimated Traffic: • 15 billion Passenger-Km • 36 million passengers • 4.7 million flights • 8400 personal aircraft: • 71% piston • 23% turboprop • 6% jet
Poland • EPATS traffic and fleet in Poland • 70 Polish domestic EPATS connections • Estimated Traffic: • 8 billion Passenger-Km • 28 million passengers • 4 million flights • 7000 personal aircraft: • 87% piston • 13% turboprop • 0% jet
Sensitivity analysis • Sensitivity analysis • Operating cost may increase in the future: • Strong fuel price increase • New environmental taxes • New material in aircraft to be compliant with SESAR • Etc. • An increase of 30% in the personal air transport cost would lead to: • 40% traffic decrease : 191 million Pax • 65% flight decrease: 15 million flights • 72% fleet decrease: 25 500 personal aircraft
Sensitivity analysis • Sensitivity analysis • France: • 44% traffic decrease : 20 million Pax • 67% flight decrease: 1.5 million flights • 80% fleet decrease: 1 600 personal aircraft • Poland: • 90% traffic decrease : 3 million Pax • 95% flight decrease: 200 000 flights • 72% fleet decrease: 200 personal aircraft
Conclusion • Conclusion • demand in personalized transport services • needs in high-speed transport in remote areas • • Transferred traffic to personal air transport in 2020: 3% of the total European traffic • 90 000 personal aircraft • 25 500 personal aircraft if their operating cost increases by 30% (fuel cost, taxes, SESAR requirements, etc.)
Thank you very much for your attention! • Any questions?