Download
1 / 2
30 likes | 241 Views
K = 2. voles. shrews. K = 3. roe deer. ticks. K = 4. bison. red deer. cattle. humans. sheep. K = 5. goat. ticks. dogs. voles. bison. cattle. sheep. shrews. horses. humans. red deer. roe deer. red foxes. wild boars. hedgehogs. cats. chamois.

E N D
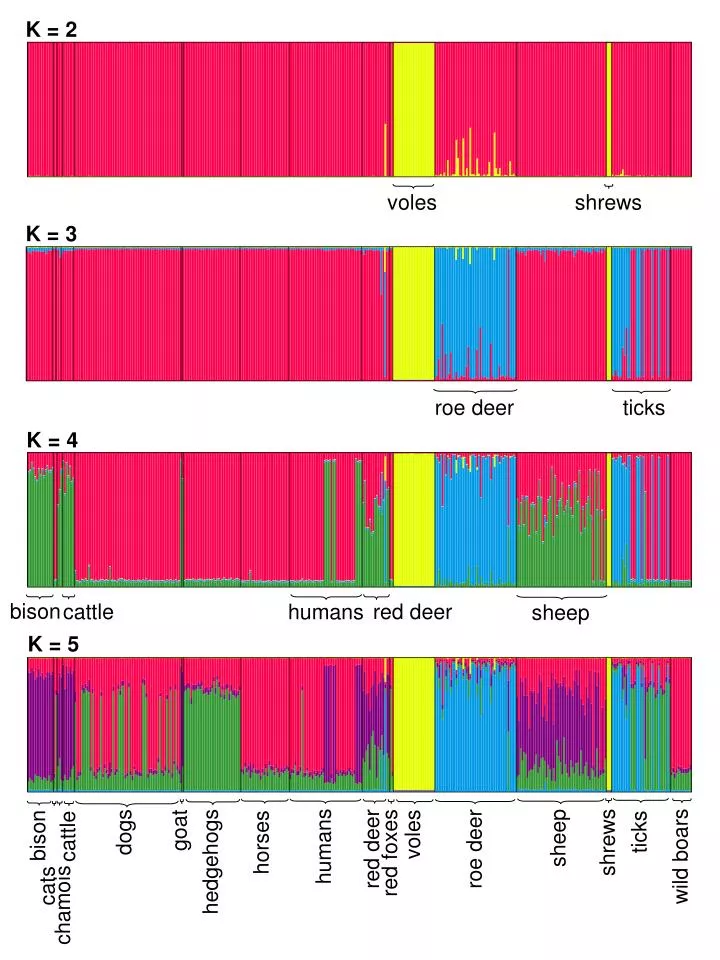
K = 2 voles shrews K = 3 roe deer ticks K = 4 bison red deer cattle humans sheep K = 5 goat ticks dogs voles bison cattle sheep shrews horses humans red deer roe deer red foxes wild boars hedgehogs cats chamois
Figure S4. DISTRUCT plots for runs of STRUCTURE assuming two to five clusters (K = 2 – 5). DISTRUCT plots for runs of STRUCTURE assuming two to five clusters are shown (K = number of clusters). A data set of 518 variable sites from the seven MLST loci was used. 383 A. phagocytophilum strains from humans, animals and I. ricinus ticks were included. Each strain is represented by a vertical line, which is partitioned into two to five colors that represent its estimated membership fractions in K = 2 to K = 5clusters. Labels below the plots provide the host origin. Black vertical lines separate the strains of different host origin.