Download
1 / 43
440 likes | 567 Views
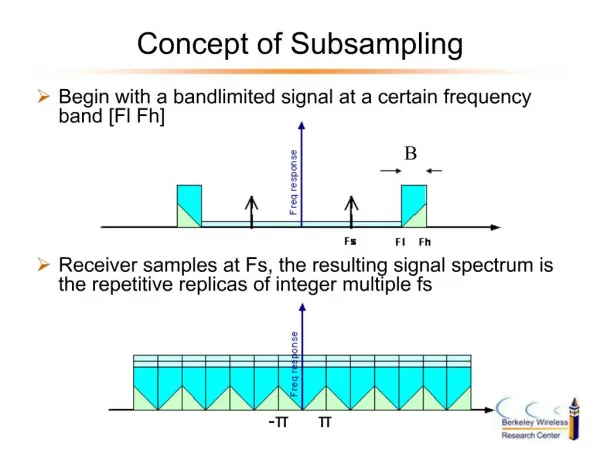
A Comparative Study on the Performance of Several Ensemble Methods with Low Subsampling Ratio. Faisal Zaman and Hideo Hirose Department of Systems Design and Informatics Kyushu institute of Technology JAPAN. Outline of the Presentation. Ensemble Learning Subsampling

E N D
A Comparative Study on the Performance of Several Ensemble Methods with Low Subsampling Ratio Faisal Zaman and Hideo Hirose Department of Systems Design and Informatics Kyushu institute of Technology JAPAN
Outline of the Presentation Ensemble Learning Subsampling Ensembles in this Study Subagging Adaboost Bundling Experiments Results Conclusion
Ensemble Learning ENSEMBLE LEARNING refers to a collection of methods that learn a target function by training a number of individual learners and combining their predictions. • Accuracy: a more reliable mapping can be obtained by combining the output of multiple “experts”. • Efficiency: a complex problem can be decomposed into multiple sub-problems that are easier to understand and solve. Example of ensemble methods : Bagging, Boosting, Double Bagging Random Forest, Rotation Forest.
Architecture of Ensemble Learning T Original Training Set Step 1: Create Multiple datasets T1 T2 TB-1 TB Step 2: Built Multiple Classifiers (Ensemble) C1 C2 CB-1 CB Step 3: Combine the decisions of the classifiers CCOM General Ensemble Architecture
Construction of Ensemble Learning So Ensemble Learning is implemented in THREE steps: • Generating multiple training sets from the original training set. This is usually done by resampling techniques; e.g., bootstrapping. These training sets have the same dimension as the original training set. • Train (construct) multiple classifiers from each of these datasets. • Combine the decisions of all these classifiers on the test set.
Construction of Ensemble Learning Using the training sets with the same dimension as the original training set is not always advantageous. In Data Mining we more often need to handle very large datasets. In those cases using ensemble method with large training sets is infeasible. To accomplish niche in these situations it is feasible to use smaller (scaling) training sets to train the multiple classifiers. In step 1, instead of bootstrapping, one can use ‘Subsampling’, which is resampling without replacement, to produce training sets smaller than the original training set.
Subsampling-definition • Subsampling is a computationally intensive resampling method. In bootstrap we take samples of size n out of n, where n is the size of the training sample; where as in subsampling we take samples of size m out of n. • In subsampling the sampling is without replacement for each sample, unlike the bootstrapping.
Subsampling-example • Let T be a training set with n elements. • A subsample Tb can be created from T choosing m elements from T randomly, without replacement. • In the following example we have created an example with 5 subsamples, each having 3 instances, which is half of the original training sample. • T T1 T2 T3 T4 T5 X(1) X(2) X(3) X(4) X(5) X(6) X(2) X(3) X(1) X(1) X(6) X(4) X(3) X(2) X(5) X(5) X(2) X(1) X(6) X(4) X(5) Example of 5 subsamples
SUBSAMPLING RATIO • In the example we have subsampled half of the training sample size for each subsample. This is called the subsampling ratio. This is denoted with ρ. • So if ρ = 0.4 and training sample size is N, then each subsample shall have ρxN instances.
Ensemble Methods used in these Study We have used three ensemble methods in this study: • Subagging • Adaboost.M1 (Multiclass version of Adaboost) • Bundling
Subagging Subbagging ( SUBsampleAGGregatING) Subbagging was proposed by P. Bühlman in 2003. In Subbagging : 1) Use ,”subsamples” to generate multiple training sets instead of bootstrap samples. 2) In the case of CART, it performs quite similar to Bagging. 3) When the size of each subsample is half of the training set then the subbagging with CART performs alike Bagging with CART.
Subagging-Architecture Step 1: Subsamples of size N* = N. ρ Step 2: Multiple Classifiers Step 3: Combine the Decisions ω1 X1N*xM Classifier 1 ωC ω1 Original Training set X2N*xM ω1 Classifier 2 ωC f(.) XNxM ω1 ωC Classifier 3 X3N*xM ωC ω1 XBN*xM Classifier B ωC
Boosting • Definition of Boosting: Boosting refers to the general problem of producing a very accurate prediction rule by combining rough and moderately inaccurate rules-of-thumb. • Boosting procedures • Given a set of labeled training examples , where is the label associated with instance • On each round , • The booster devises a distribution (importance) over the example set • The booster requests a weak hypothesis (rule-of-thumb) with low error • After T rounds, the booster combine the weak hypothesis into a single prediction rule.
Adaboost • The framework • The learner receives examples chosen randomly according to some fixed but unknown distribution on • The learner finds a hypothesis which is consistent with most of the samples • The algorithm • Input variables • P: The distribution where the training examples sampling from • D: The distribution over all the training samples • WeakLearn: A weak learning algorithm to be boosted • T: The specified number of iterations
Multi-class Extensions • The previous discussion is restricted to binary classification problems. The set Y could have any number of labels, which is a multi-class problems. • The multi-class case (AdaBoost.M1) requires the accuracy of the weak hypothesis greater than ½. This condition in the multi-class is stronger than that in the binary classification cases
AdaBoost.M1 • The algorithm
In the input, instead of N instances, to train each classifier, we shall take randomly N*ρ instances without replacement (subsmpling). AdaBoost.M1 with Small Subsamples
Bundling Bundling was first proposed by TorstenHothorn in 2005. The main idea of bundling lies in adding a SET of additional predictors with the original predictors. • These additional predictors are generated from the out-of-bag sample. • In bagging in each bootstrap replicate 63% of the original training instances are sampled, where as the rest (37%) are unsampled; these samples are called out-of-bag samples (OOBS). • In Bundling classifiers models are built using these OOBS and then trained back on the bootstrap replicates to generate the set of additional predictors.
Bundling-Algorithm In general the Bundling algorithm is performed as the following steps: Step 1: Generate bootstrap sample from the training set. Step 2: From the out-of-bag sample construct a set of additional classifier models. Step 3a: Use these additional classifiers on the bootstrap sample to generate additional predictors. Step 3b: Do the same for a test instance x, and generate additional predictors with x. Step 4: Build a tree classifier model with bootstrap sample and the additional predictors. Step 5: Combine all the tree models using, “average” rule. Step 6: Classify a test instance x with the additional predictors using the combined tree( tree ensemble).
SUBSAMPLE IN BUNDLING ALGORITHM In Bundling instead of bootstrap samples, we can use subsamples. This has two major advantages: • it will enlarge the out-of-bag sample size, which entails a better learning of the additional classifier. • the time complexity of the ensemble learning will be reduced. The subsampled version of bundling is defined as, ‘Subbundling’. N = No. of Observations in Training Set ρ = Subsampling Ratio Sampling without replacement T N*ρ = size of subsample T Training Set O N*(1-ρ) = size of out-of- bag sample O
Experiment- Setup • We have used five small subsampling ratios (SSR) to create the training sets for the ensemble classifiers; i.e., ρ = 0.1, 0.2, 0.3, 0.4 and 0.5. • Each ensemble size is fixed to 50. • Misclassification error and Time Complexity (in seconds) are used as the performance assessment measure. • 10-fold cross-validation method is used to calculate the accuracy of the ensemble methods. We have repeated 15 times and reported the average error over the repetitions. • For subbundling we have used a set of additional classifier models, consists of Radial Support Vector Machine (RSVM), Linear SVM, Stabilized Linear Discriminant Classifier (sLDA) and Logistic Classifier (LogLc). • We have used 15 benchmark datasets from UCI (University of California Irvine) Machine Learning Repository to perform all the experiments.
Experiment- Aim • Check the performance of the ensembles in terms of • Accuracy • Time complexity with all the SSRs. • Find out the optimum SSR for all the ensembles in this study. That is with which SSR the ensemble has performed superiorly than with other SSRs considering the performance measures. • Compare the performance of the ensembles with their bootstrap counterparts. • Compare the ensembles with each other with all the SSRs in terms of the performance measures. • Compare these ensembles (with their respective optimum SSR) with the contemporary ensemble methods. We have used here, Bagging, Adaboost, Bundling and Rotation Forest. For this comparison we have used accuracy as the performance measure. • Find out the BEST scalable ensemble method among all these ensembles with statistical inference.
Results- Subagging SUMMARY Accuracy (Error): Subagging with SSR = 0.2 Average Value: 0.1842 Time (in seconds) : Subagging with SSR = 0.1 Average Value: 1.10
Results- Subagging PLOT: Average Misclassification Errors of Subagging with SSR: 10%-50% and Bagging. PLOT: Average time (in seconds) of Adaboost with SSR: 10%-50% and original. r = 0.997645 r = 0.630975
Results- Adaboost SUMMARY Accuracy (Error) : Adaboost Average Value: 0.1779 Time (in seconds) : Adaboost with SSR = 0.1 Average Value: 1.93
Results- Adaboost Average Misclassification Error Average time (in seconds) r = 0.996892 r = -0.92649 PLOT: Average Misclassification Errors of Adaboost with SSR: 10%-50% and original. PLOT: Average time (in seconds) of Adaboost with SSR: 10%-50% and original.
Results- Bundling SUMMARY Accuracy (Error) : Subbundling with SSR = 0.5 Average Value: 0.1445 Time (in seconds) : Bundling Average Value: 15.05
Results- Bundling Average Misclassification Error Average time (in seconds) r = -0.95307 r = -0.99609 PLOT: Average Misclassification Errors of Subbundling with SSR: 10%-50% and bundling. PLOT: Average time (in seconds) of Subbundling with SSR: 10%-50% and bundling.
Results- Comparison between subagging, adaboost and bundling PLOT: Average Misclassification Errors of Subagging, Adaboost and Bundling with SSR = 10%-50% and the original versions of these ensemble methods. PLOT: Average Misclassification Errors of Subagging, Adaboost and Bundling with SSR = 10%-50% and the original versions of these ensemble methods. Subag with SSR = 0.2 Low Complexity than Subbundling Subbundle with SSR = 0.5
Optimum Predictor Ratio (OPR) The OPR for any predictor (here ensemble) in any dataset, can be defined as following: So if any ensemble perform remarkably better than other ensemble methods, then its average OPR values will be around 1. It is best observed from a boxplot. Value of the Performance Measure of that ensemble in that dataset OPR = Minimum value of the Performance Measure of all the other ensembles in that dataset
Boxplot of OPR values PLOT:Boxplot of OPR values of Rotation Forest, Bundling, Subbundling (SSR = 0.5), Adaboost.M1, Bagging and Subagging (SSR = 0.2)
Conclusion • From accuracy point of view subbunlding has far better performance that subagging and adaboost with SSRs. Subundling with SSR = 0.5 has the best accuracy among these ensembles. • From time complexity point of view, subagging has lowest time complexity with SSRs. • Subagging with SSR = 0.1 has the lowest time complexity. • Adaboost performed worst with SSRs; where as subagging showed very promising performance as its average error with SSRs are quite often better than bagging. • In overall comparison the subbundling with SSR = 0.5 has superior performance than Bundling and Rotation Forest. This is well observed in the boxplot of the OPR values.