Download
1 / 39
390 likes | 510 Views
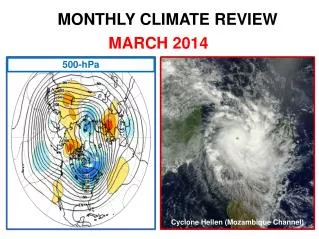
June 2013 Monthly Climate Review. Qin Ginger Zhang. Appreciations: Kingtse Mo, Caihong Wen, Jon Gottschalck , Muthuvel Chelliah , and others . Outline. Tropical Overview: ENSO conditions MJO and Tropical Storms Global Overview U.S . Climate

E N D
June 2013Monthly Climate Review Qin Ginger Zhang Appreciations: Kingtse Mo, Caihong Wen, Jon Gottschalck, MuthuvelChelliah, and others
Outline • Tropical Overview: • ENSO conditions • MJO and Tropical Storms • Global Overview • U.S. Climate • Forecast Verification (Monthly/Seasonal) • Notable events and outlooks
Ocean Briefing Evolution of Pacific NINO SST Indices • All Nino indices were negative, with Nino 3.4 = -0.2 oC • ENSO-neutral conditions continued in June 2013. • The indices were calculated based on OISST. They may have some differences compared with those based on ERSST.v3b. Fig. P1a. Nino region indices, calculated as the area-averaged monthly mean sea surface temperature anomalies (oC) for the specified region. Data are derived from the NCEP OI SST analysis, and anomalies are departures from the 1981-2010 (bar) and last ten year (green line) means.
Ocean Briefing Evolution of Pacific SST Anomalies
Ocean Briefing Equatorial Pacific SST (ºC), HC300 (ºC), u850 (m/s) • Negative SSTA occupied in the far eastern Pacific since May, 2013. • HC300 anomalies in the central equatorial Pacific switched to positive phase in June, 2013.
Drought Briefing Sub surface temperature anomaly Positive anomalies Negative anomalies
200-hPa Velocity Potential Anomalies (5°S-5°N) Positive anomalies (brown shading) indicate unfavorable conditions for precipitation Negative anomalies (green shading) indicate favorable conditions for precipitation The MJO strengthened in late December, (alternating dashed and dotted lines) and anomalies increased in magnitude with more robust eastward propagation indicated during late 2012 to April 2013. Anomalies became less coherent at times during late January and early February as the influence from other modes of variability are evident in the depicted anomalies. Some reorganization is evident in late February and early March. The velocity potential anomalies were more coherent only briefly during early to mid-May. Recently, the signal is more coherent and consistent with a canonical MJO footprint, although other modes are still apparent. Time Longitude
OLR Anomalies – Past 30 days Ocean Briefing Drier-than-normal conditions, positive OLR anomalies (yellow/red shading) Wetter-than-normal conditions, negative OLR anomalies (blue shading) During early June, a more coherent pattern of enhanced (suppressed) convection developed over the Indian Ocean, Maritime Continent, and Australia (central and eastern Pacific and Africa). An area of enhanced convection continued to shift eastward to the Gulf of Mexico and Caribbean. The enhanced convective anomalies propagated eastward over the Maritime Continent into the western Pacific during mid-June. During late June, enhanced (suppressed) convective anomalies continued an eastward propagation into the eastern Pacific, western Atlantic, and Africa (Indian Ocean, Maritime Continent, and western Pacific).
MJO Index -- Recent Evolution • The axes (RMM1 and RMM2) represent daily values of the principal components from the two leading modes • The triangular areas indicate the location of the enhanced phase of the MJO • Counter-clockwise motion is indicative of eastward propagation. Large dot most recent observation. • Distance from the origin is proportional to MJO strength • Line colors distinguish different months The MJO index maintained a steady eastward propagation into phase 1 (Western Hemisphere and Africa) during the end of June.
CFSv2 MJO forecast for 30-day WH-MJO Index and 45-day Velocity Potential Anomaly
Andrea (June 5-7), First Named Tropical Storm Of 2013 Season, Forms In Gulf SUMMARY TABLE NAME DATES MAX WIND (MPH) --------------------------------------------------- TS ANDREA 5-7 JUN 65 TS BARRY 17-20 JUN 45 ---------------------------------------------------
Ocean Briefing Global SST Anomaly (0C) and Anomaly Tendency • SST was near-normal across the western-central tropical Pacific and below average across the eastern Pacific. • Negative PDO-like pattern continued in N. Pacific. • Large Positive SST anomalies emerged near the Norwegian Sea and Western North Atlantic . • A weak warming tendency was observed across the eastern equatorial Pacific. • Strong warming tendencies were observed along the Gulf of Mexico, Norwegian Sea and the eastern coast of Asia. Fig. G1. Sea surface temperature anomalies (top) and anomaly tendency (bottom). Data are derived from the NCEP OI SST analysis, and anomalies are departures from the 1981-2010 base period means.
Global Monthly Mean Temperature Anomaly Anomaly: from 1971-2000 Climatology (unit: deg C) Ranking Percentile: from 1948-2004 period.
Global Monthly Mean Precipitation Anomaly Anomaly: from 1971-2000 Climatology (unit: mm) Ranking Percentile: If precipitation is zero in more than one year during 1948-2004,the ranking percentile is undefined and not shown in the map.
Streamflow percentile (USGS) • Low flow conditions in the Southwest, Colorado , Four Corners , California and Nevada • Wetness over the Great Lake region and the Southeast , the Northeast and the East Coast
Drought Briefing SPI • Southwest , California , the western interior states except the Northwest were under drought. • Overall, there is a west-east contrast: the eastern U.S. and the Great Lake areas had persistent wet spells and the western region is under drought D3 D2 D1
Drought Briefing Feb 26,2013 Drought monitor • The eastern U.S. is free from drought. • Drought continues over the Southern Plains, • the Western States are still under drought except Washington and Montana
June Temperature Forecast Verification Observations Original Forecast Revised Forecast Non-EC Skill Score: 39.15; non-EC coverage: 45.69% All Forecasts: 17.89 Non-EC Skill Score: 45.31; non-EC coverage: 41.38% All Forecasts: 18.75
June Precipitation Forecast Verification Observations Original Forecast Revised Forecast Non-EC Skill Score: 32.81; non-EC coverage: 41.38% All Forecasts: 13.58 Non-EC Skill Score: 12.50; non-EC coverage: 25.86% All Forecasts: 3.23
AMJ Temperature Forecast Verification Observations Official Forecast Non-EC Skill Score: -13.51; non-EC coverage: 79.74% All Forecasts: -10.78
AMJ Precipitation Forecast Verification Observations Official Forecast Non-EC Skill Score: 47.71; non-EC coverage: 46.98% All Forecasts: 22.41
The Northern Indian Floods Uttarakhand • The northern state of Uttarakhand, India, is home to many holy temples and pilgrimage centers, with a population of ~10mil (2011 census). • The state is a popular summer vacation destination for tourists and a religious journeyers. • As of 24 June 2013, more than 1000 people have been killed as a result of torrential rains from 15-17 June 2013. • Early torrential rains caught hundreds of thousands of tourists, pilgrims, and local residents by surprise. http://www.independent.co.uk/news/world/asia/indian-home-minister-says-uttarakhand-flood-death-toll-over-1000-and-still-rising-8671070.html
Uttarakhand Floods http://www.indianexpress.com/picture-gallery/rescue-operations-underway-in-floodhit-uttrakhand/2922-1.html
Heat wave scorches Death Valley, America’s hottest of the hot California's Death Valley National Park tentatively recorded a high temperature of 129 degrees in June 30, 2013 , which would tie the all-time June record high for the United States. The world record highest air temperature of 134°F (57°C) was recorded at Furnace Creek on July 10, 1913
Montgomery County tornado track among longest on record June 13, 2013 d in D.C. area