Download
1 / 54
540 likes | 717 Views
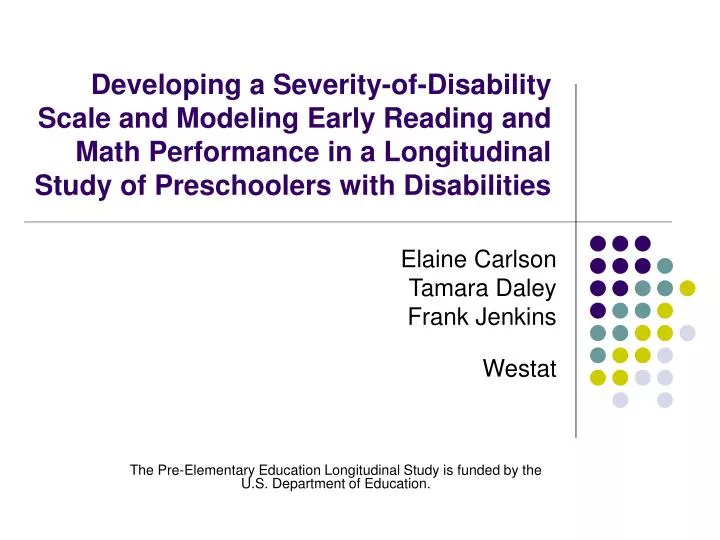
Developing a Severity-of-Disability Scale and Modeling Early Reading and Math Performance in a Longitudinal Study of Preschoolers with Disabilities. Elaine Carlson Tamara Daley Frank Jenkins Westat

E N D
Developing a Severity-of-Disability Scale and Modeling Early Reading and Math Performance in a Longitudinal Study of Preschoolers with Disabilities Elaine Carlson Tamara Daley Frank Jenkins Westat The Pre-Elementary Education Longitudinal Study is funded by the U.S. Department of Education.
PEELS design • 6-year national longitudinal study of preschoolers with disabilities, currently in its fourth year. • Designed to describe • the children, • the services they receive, • their transitions from early intervention to preschool and preschool to elementary school, and • their early academic and functional skills. • Sample includes 3,104 children who were ages 3-5 and were receiving special education services in 2003-04. • Produces statistical estimates that generalize to the national population of children with disabilities ages 3-5.
PEELS design, cont’d • Data collection • a one-on-one assessment of early academic skills, • a parent telephone interview, • mail questionnaires to children’s teachers and school-, district-, and state-level administrators, and • indirect assessments of students’ social skills, problem behaviors, academic skills, and motor skills
Sample design • Nationally representative sample of 223 LEAs (208 in Wave 1, plus 15 added in Wave 2) • LEAs stratified by • enrollment size • geographic region • wealth
LEA participation • Main sample • 709 released for recruiting • 245 agreed in 2001 • 189 participated in 2003-04 (Wave 1) • Nonresponse sample • 32 of 464 non-recruited LEAs selected • 19 participated in 2003-04 (Wave 1) • Supplemental sample to add 1 previously nonparticipating SEA • 15 of 24 participated in 2004-05 (Wave 2) • Total Sample = 223 LEAs
Family participation Wave 1 main and nonresponse samples (ages 3-4 in 2003-04) • 52,871 on sampling frame • 5,330 selected • 4,072 eligibility determined • 2,906 agreed (81% of those eligible)
Family participation Wave 2 supplemental sample (ages 4-6 in 2004-05) • 7,727 on sampling frame • 542 selected • 433 eligibility determined • 198 agreed (63% of those eligible) Total sample = 3,104 families
Unweighted response rates, by wave -Not applicable * QED data were used to supplement these data, bringing percentage of children with some school data in waves 1, 2, & 3 to 94%, 95%, & 94%, respectively
Demographic characteristics NOTE Demographic and household characteristics are for the unweighted sample. SOURCE: U.S. Department of Education, National Center for Special Education Research, Pre-Elementary Education Longitudinal Study (PEELS), “Parent Interview (Wave 1 for main and nonresponse samples, Wave 2 for supplemental sample),” previously unpublished tabulation.
Household characteristics SOURCE: U.S. Department of Education, National Center for Special Education Research, Pre-Elementary Education Longitudinal Study (PEELS), “Parent Interview (Wave 1 for main and nonresponse samples, Wave 2 for supplemental sample),” previously unpublished tabulation.
Primary disabilities NOTE Low incidence includes visual impairment, hearing impairment, deaf-blindness, traumatic brain injury, multiple disabilities. SOURCE: U.S. Department of Education, National Center for Special Education Research, Pre-Elementary Education Longitudinal Study (PEELS), ‘Early Childhood and Kindergarten Teacher Questionnaires (Wave 1 for main and nonresponse samples, Wave 2 for supplemental sample),” previously unpublished tabulation.
Severity • Under IDEA, children classified according to one of 13 disability categories • Children in each category have a range of abilities • Heterogeneity within categories often overlooked • Categorical labels especially problematic for preschoolers
Approaches to measurement • Pediatric health conditions (PEDI, WeeFim) • Self-care, mobility, and social cognition • Require a certain threshold of impairment • Single disability conditions in children • Hearing, vision, language, depression • ICIDH (WHO, 1980) • Published as a research tool • Not widely adopted for use
Approaches to measurement • ABILITIES Index (Simeonsson & Bailey, 1991): Severity in 9 domains • Audition • Behavior and social skills • Intellectual function • Limbs • Intentional communication • Tonicity • Integrity of physical health • Eyes • Structural status
Approaches to measurement (cont’d) • Since its original publication, 6 new domains added (Simeonsson, 2006): • Regulation of attention, • Regulation of activity level, and • Regulation feeling/emotions, • Academic skills, • Motivation, and • Impulse control
ABILITIES index • In Special Education Expenditures Project (SEEP) (Chambers et al., 2004) : • Federal disability category able to explain only 10% of the variation in total expenditures • In contrast, the ABILITIES Index alone was able to account for 40% of the variation in total educational expenditures for special education students • Including the federal disability categories increased the variance accounted for by 2%
Question of current study To what extent do functional markers of severity of childhood disability predict measurement of child outcomes?
Overall method • Identify items from parent interview similar to ABILITIES domains • Create composite domains where necessary • Examine distribution of severity within the 15 domains • Examine regressions of the 15 domains on multiple outcomes • Create short version of index using 6 domains • Compare 6 domain and 15 domain versions of index to outcomes to select better version • Compare 6 domain version of index with other indicators of severity
Outcome measures Wave 1 data • Cognitive • PPVT-III • Woodcock-Johnson III: Letter-Word Identification • Woodcock-Johnson III: Applied Problems • Social/Behavioral • PKBS Social Competence • PKBS Problem Behaviors • Alternate Assessment • ABAS Conceptual Domain • ABAS Practical Domain • ABAS Social Domain
Creating the severity measure • Used parent report from Wave 1 CATI • Created 4-point scale for each domain (normal/typical, mild, moderate, severe) • 11 domains already with 4 point scales: 4 levels of severity • 4 domains with 3 point scales: 1 1, 2 2, 3 4 to preserve range
Creating the severity measure • Some domains matched to a single question • Use of arms (within limbs domain): “How well does {child} use {his/her} arms and hands for things like throwing, lifting, or carrying?” • Motivation: “Some children try to finish things, even if it takes a long time. How much does this sound like {child}… ” • For domains with multiple questions, worked with ABILITIES Index author to best reflect original intention of domain
Example: Combining Items to Create ‘Communication with Others’ When {CHILD} talks to people {he/she} doesn’t know well, is {he/she} 1: Very easy to understand 2: Fairly easy to understand 3: Somewhat hard to understand 4: Very hard to understand 5: DOES NOT OR WILL NOT TALK AT ALL Compared with other children about the same age, how well does {CHILD} make {his/her} needs known to you and others? Communication can be any form, for example crying, pointing or talking. Would you say {he/she} 1: Communicates just as well as other children 2: Has a little trouble communicating 3: Has a lot of trouble communicating 4: Does not communicate at all? 1: Communicates just as well as other children and very easy to understand 2: Some difficulties communicating or being understood 3: Moderate difficulties communicating or being understood 4: Does not communicate at all or very hard to understand
ResultsPopulation weighted percentages (n = 2,986) • Audition, vision, use of arms, legs, regulation of emotions • 80-95% in normal/typical category • Inappropriate or unusual behavior, overall health, social skills, use of hands, understanding • 50-60% in normal/typical, 20-30% mild
ResultsPopulation weighted percentages (n = 2,986) • Motivation, regulation of attention, regulation of activity level, • 20-30% in normal/typical, 33-42% mild, 16-30% severe • Communicating with others • 29% in normal/typical, 9% mild, 45% moderate, 17% severe • Intellectual function • 10% in normal/typical, 43% mild, 32% moderate, 14% severe
Regressions on outcome variables • All predictors entered simultaneously; examined beta weights and bivariate correlations between predictors and each outcome • Significant predictors of at least three outcomes:cognition, communicating with others, understanding, overall health, and regulation of activity level • Significant predictor of two outcomes:regulation of attention • The remaining severity domains generated a mixture of significant and nonsignificant associations • No significant loading on any outcome variables: use of hands and arms and use of legs
Creation of indices • Index A, 15 items: Sum of all domains • Index B, 6 items: cognition, communicating with others,understanding, overall health,regulation of activity, regulation of attention • No significant differences in correlations between Index A and outcomes and Index B and outcomes
Index A and B correlations with outcomes *The associated p-values are less than .0001 for all coefficients.
Final severity measure items • Cognition • Communicating with others • Understanding • Overall health • Regulation of activity • Regulation of attention
Validation: correlations between Index B and other indicators • Wave 1 Parent report: Age at which children began receiving special education or therapy servicer (2,802) = -.22, p< .0001 • Wave 1 Teacher report: Amount of modification needed to curriculum materialsr (248) = .42, p< .0001 • Wave 1 Teacher report: Number of services the child receives in school r (2,014)= .37, p< .0001
Validation: comparison of mean scores on severity measure • From teacher/parent declassification measure, Wave 1: Children remaining in special educationM = 13.2Children no longer receiving special education M = 10.7 , p < .0001 • From assessment measures, Wave 1:Children taking the alternate assessment M = 16.3Children completing the direct assessmentM = 12.4, p < .0001
Summary • To what extent do functional markers of severity of childhood disability predict measurement of child outcomes? • Of the 15 domains examined, most were significant predictors of at least two outcomes • An index of only six variables was as effective as the longer version • Severity was significantly correlated with intervention variables • Severity differentiated children in two groups
Hierarchical analysis • PEELS has children in naturally-occurring hierarchies: • time points within children • children within districts • districts
What we want to know • What factors relate to children’s cognitive growth over 3 years? • What we have • observations of PEELS children over 3 years. • Yearly information about child’s SES, health, severity, and services received • Yearly measures of 3 academic outcomes • Adapted Peabody Picture Vocabulary Test (PPVT) • Woodcock-Johnson III: Letter-Word Identification • Woodcock-Johnson III: Applied Problems
Problem: How to make sense out of longitudinal data • Hierarchical data is clustered: i.e., repeated measures are not independent observations. Standard regression assumes independent observations. • Ordinary repeated measures analyses do not allow for missing time points or clustering. • Repeated cross-sectional analyses ignore the growth of individual children. Mean growth is not the same as growth of individuals.
Solution: Hierarchical linear modeling • Data is modeled at 3 levels of hierarchy at the same time. • Most of the clustering in the sample is accounted for, leading to correct statistical tests. • Focus is on individual growth profiles. Modeling seeks to explain differences in growth between children.
Districts Level 3 . . . . District n District 1 Si Students S1 Si S1 Level 2 . . . . . . . . W/in District 3 time points T3 T1 T3 T2 T1 T3 Level 1 T1 T2 T3 T2 T1 T2 per student Hierarchical structure of data
HLM model • Level 1: Repeated observations within child is the outcome for individual i measured at wave t . is the age of the child at time at time t. is the growth intercept: average achievement for the individual is the growth curve slope: How much the outcome changes over years. is a random error term.
HLM modelLevel 2: Children nested within districts. is an intercept for child ji, is the individual growth curve for child ji are child factors that predict growth. to is the deviation from average achievement for each child. is the deviation from average growth for each child.
HLM modelLevel 3: Districts Where, is the achievement status of district j , is the grand mean of achievement, and is the district effect on achievement.
Hypothetical growth curve HLM Individual slopes estimated for high & low severity children <- Low severity <- High severity
Individual slopes estimated for high & low severity children <- Low severity <- High severity
Four Sets of Predictors • Predictors are added in four sets of similar variables. These sets include • SES: e.g., mother’s education, SES scale • Severity: e.g., severity scale, age services started • Health: e.g., child’s general health, health scale • Services: e.g., % time in a regular classroom, parent involvement scale
Predictors of PPVT growth Accounted for 22 % of PPVT growth Note: Controlled for age and cohort
Predictors of Letter-Word growth Accounted for 57 % of Letter-Word growth Note: Controlled for age and cohort
Predictors of Applied Problems growth (continued) Accounted for 12 % of Applied Problems growth Note: Controlled for age and cohort