Download
1 / 28
280 likes | 428 Views
Biost 511 DL Discussion Section. Announcements Quiz 1 (CEU students only) Will be available on Canvas.uw.edu Friday 12 pm – Sunday 11:59 pm One hour to complete (from time you begin) Questions?. Medical Biometry I. ( Biostatistics 511) Discussion Section Week 2 Mike Garcia.

E N D
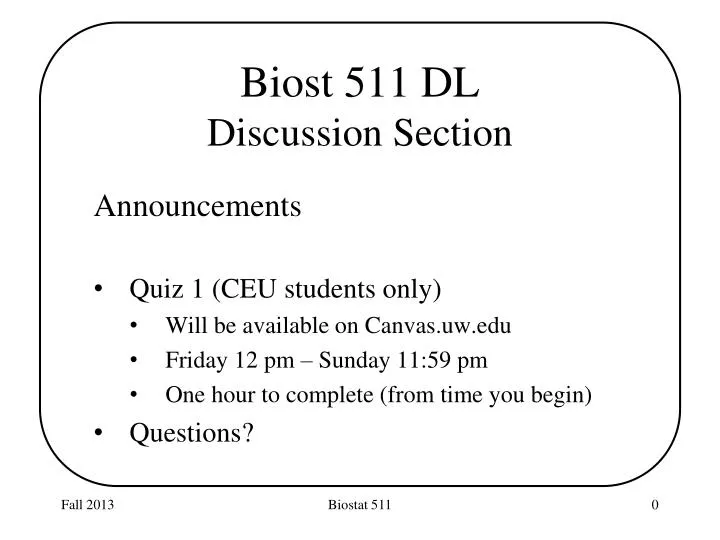
Biost 511 DLDiscussion Section Announcements Quiz 1 (CEU students only) Will be available on Canvas.uw.edu Friday 12 pm – Sunday 11:59 pm One hour to complete (from time you begin) Questions? Biostat 511
Medical Biometry I (Biostatistics 511) Discussion Section Week 2 Mike Garcia Biostat 511
Lecture Outline • Review of HW #1 • Key Concepts/Topics from Weeks 1 & 2 • Computer lab Biostat 511
Homework #1 • Overall very good responses • A few of you did not submit a response for problem 0. Note that future assignments with missing responses will receive a zero, regardless of the quality of the rest of the submission. Biostat 511
Homework #1: Formatting • Please don’t include raw Stata (or other software) output! Extract the relevant information and summarize neatly. • Rounding to 2 or 3 decimal places helps make your responses more readable. Biostat 511
Homework #1: Random sampling/bias • A common mistake was thinking that only sampling a subset of the population of freshman women would lead to biased estimates. • It really depends on how the sampling is done. If it is completely random, we expect the random subset to be, on average, similar to the population and would not expect bias. (e.g. 100 letters randomly sent out). • If the subset differs from the population, then we would not expect them to be similar and there may be bias (e.g. more sexually active women responding to the study. Biostat 511
Scientific Method/Statistical thinking 2. Define measurable quantity to answer question 1. Scientific question/ Research hypothesis 6. Make decision about research question 3. Design experiment/study to gather data 5. Analyze data 4. Collect data Biostat 511
Example: Infection in Cystic fibrosis Cystic fibrosis (CF) affects 30,000 individuals in the U.S. The condition is complicated by recurrent pulmonary infection. A study was conducted to determine if the aerosolized antibiotic tobramyacin was effective in treating recurrent bacterial infection in CF patients. 520 CF patients, 10 to 60 years of age, were randomized to receive tobramycin or placebo in a double-blind controlled trial. The primary endpoint was the pulmonary function test forced expiratory volume in one second (FEV1 ). Measurements were collected at baseline and again at the end of the 24-week study period. Biostat 511
Cystic fibrosis example What is the scientific question? What is the Experimental Design? What is the measured quantity used to investigate the scientific question? Biostat 511
Population vs. Sample • POPULATION: the entire group of • individuals of interest. • SAMPLE: a subset of individuals • selected from the population • Populations are characterized by • parameters. • Samples are characterized by statistics. • Parameters and statistics typically summarize • the distribution of measured values on • population/sampling units. Biostat 511
Cystic fibrosis example What is the population? What is the sample? What is one population parameter of interest? What is the corresponding statistic? Biostat 511
Types of Variables • Binary (0/1) • Categorical • Nominal • Ordinal • Quantitative • Discrete • Continuous • Examples: • Department affiliation • Sex • Weight • Number of students in the class • Likert scale Biostat 511
What kind of variables are in the CF dataset? Y0: FEV1 pre-treatment Y1: FEV1 post-treatment T: Treatment group (0/1) New variable: diff=Y1-Y0 Biostat 511
Types of statistical analyses: descriptive • Not hypothesis driven • Goal: summarize data • --univariate: location, spread of individual measures • --bivariate: relationships between two variables • Explore data, numerically and graphically • Interesting patterns lead to new hypotheses Biostat 511
Descriptive statistics: CF example • Summarize distributions of baseline Y0, Y1, • and the FEV1 difference. • central tendencies • spread • shape of distributions • relationship between Y0, Y1 • outliers Biostat 511
Types of statistical analyses: inferential • A priori scientific question. • Translate question into statistical hypothesis or quantity to esitmate • Assume a model for the data • Test the hypothesis/estimate the parameter • Describe uncertainty about the estimate about the estimate or the statistical test Biostat 511
CF example: inferential statistics • A priori scientific hypothesis: Individuals treated on the drug have • on average, less reduction in FEV1 from baseline to follow up compared • to the control group. • Goal of inferential statistics: • Draw conclusions about the population of CF patients from the sample. • Test if data support this hypothesis • Estimate differences in FEV1 in both groups, with uncertainty bounds Biostat 511
Univariate summaries: quantitative variables Central Tendency: Mean, Median, Mode Spread Variance, standard deviation, IQR Shape of distribution Skewness Outliers Biostat 511
Percentiles The p-thpercentile is the value which has p% of the sample values less than or equal to it. Median=50th percentile Interquartile range 25%-75% percentile (indicator of spread) Biostat 511
Box plots Biostat 511
Histograms and density functions -Histograms tell us the probability of obtaining data in a given interval. -Probability density functions (pdfs) are mathematical functions yielding similar information. -STATA can approximate pdf of a variable. -X is the variable -P(0<X<2) given by area Under the curve between 0,2 Biostat 511
Normal distribution --bell-shaped curve --symmetric --parameterized by mean and standard deviation Normal probability density function Biostat 511
CF example: Y0 Histogram with superimposed normal curve hist Y0, norm Biostat 511
Computer Lab • Problem • Investigate the efficacy of an experimental treatment • Target Population: children with CF • Sample: 520 patients between 3-18 years of age • Treatment: Aerosolized antibiotic • Variables • Treatment assignment indicator (T=1 is treatment; T=0 is control) • Y1 = FEV1 at the end of the study (24 weeks) • Y0 = FEV1 prior to randomized group assignment • Scientific Questions: • Is the baseline FEV1 the same between treatment groups prior to randomization? • Is there evidence of a treatment effect? Biostat 511
Conclusions from lab *Are there differences in the baseline FEV1 by treatment group: Why does this matter? *Do you think there is evidence for a treatment effect? Why or why not? Biostat 511
Summary • Week 1 key concepts • Scientific method and statistics • Types of variables • Descriptive versus inferential statistics • Population versus samples • Univariate summary measures • Plots (boxplot, histograms, density plots) • 7. Introduction to normal probability density • Problem / lab • 1. Description and scientific question • 2. Summaries (statistics and graphics) • 3. Conclusions Biostat 511
Relationships between 2 variables: scatter plots Biostat 511
Relationships between 2 variables : correlation Pearson’s correlation coefficient: what is the degree of linear association Between 2 variables? Ranges between -1 to 1. 0 => no correlation (generally) . corr Y0 Y1 (obs=520) | Y0 Y1 -------------+------------------ Y0 | 1.0000 Y1 | 0.8932 1.0000 Biostat 511