Download
1 / 32
320 likes | 617 Views
Introduction. Many quality characteristics cannot be conveniently represented numerically. In such cases, each item inspected is classified as either conforming or nonconforming to the specifications on that quality characteristic. Quality characteristics of this type are called attributes. Examp

E N D
1. Control Chart for Attributes
Bahagian 1
2. Introduction Many quality characteristics cannot be conveniently represented numerically.
In such cases, each item inspected is classified as either conforming or nonconforming to the specifications on that quality characteristic.
Quality characteristics of this type are called attributes.
Examples are nonfunctional semiconductor chips, warped connecting rods, etc,.
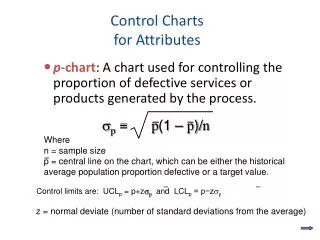
4. Type of Attribute Charts p charts
This chart shows the fraction of nonconforming or defective product produced by a manufacturing process.
It is also called the control chart for fraction nonconforming.
np charts
This chart shows the number of nonconforming. Almost the same as the p chart.
c charts
This shows the number of defects or nonconformities produced by a manufacturing process.
u charts
This chart shows the nonconformities per unit produced by a manufacturing process.
5. p charts In this chart, we plot the percent of defectives (per batch, per day, per machine, etc.).
However, the control limits in this chart are not based on the distribution of rate events but rather on the binomial distribution (of proportions).
6. Formula Fraction nonconforming:
p = (np)/n
where p = proportion or fraction nc in the sample or subgroup, n = number in the sample or subgroup, np = number nc in the sample or subgroup.
7. Example During the first shift, 450 inspection are made of book-of the month shipments and 5 nc units are found. Production during the shift was 15,000 units. What is the fraction nc?
p = (np)/n = 5/450 = 0.011
The p, is usually small, say 0.10 or less.
If p > 0.10, indicate that the organization is in serious difficulty.
8. p-Chart contruction for constant subgroup size Select the quality characteristics.
Determine the subgroup size and method
Collect the data.
Calculate the trial central line and control limits.
Establish the revised central line and control limits.
Achieve the objective.
9. Select the quality characteristics The quality characteristic?
A single quality characteristic
A group of quality characteristics
A part
An entire product, or
A number of products.
10. Determine the subgroup size and method The size of subgroup is a function of the proportion nonconforming.
If p = 0.001, and n = 1000, then the average number nc, np = 1. Not good, since a large number of values would be zero.
If p = 0.15, and n = 50, then np = 7.5, would make a good chart.
Therefore, the selection subgroup size requires some preliminary observations to obtain a rough idea of the proportion nonconforming.
11. Collect the data The quality technician will need to collect sufficient data for at least 25 subgroups.
The data can be plotted as a run chart.
Since the run chart does not have limits, its is not a control chart.
12. Calculate the trial central line and control limits The formula:
= average of p for many subgroups
n = number inspected in a subgroup
14. p Chart
15. Establish the revised central line and control limits Determine the standard or reference value for the proportion nc, po.
where npd = number nc in the discarded subgroups
nd = number inspected in the discarded subgroups
16. Revised control limits
where po is central line
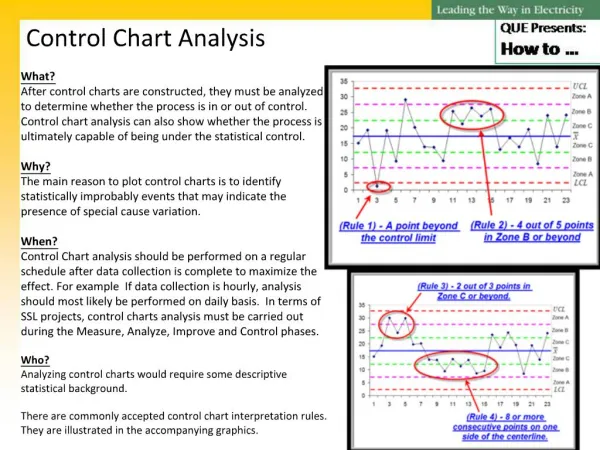
17. Achieve the objective The first 5 steps are planning (p304-308).
The last step involves action and lead to the achievement of the objective.
The revised control limits were based on data collected in May.
For June, July, August? See Fig 8-3, p.310
Quality improved?
18. Analysis of June results shows the quality improved.
Using June data, a better estimation of proportion nc is obatained.
The new value: po = 0.014, UCL = 0.036
Data from July are used to determine CL & UCL for August.
19. np Chart The np chart is almost the same as the p chart.
Central line = npo
If po is unknown, it must be determined by collecting data, calculating UCL, LCL.
20. Example
22. c Chart The procedures for c chart are the same a s those for the p chart.
If count of nonconformities, co, is unknown, it must be found by collecting data, calculating UCL & LCL.
= average count of nonconformities
23. Example
25. Revised Out-of-control: sample no. 5, 11, 23.
26. u Chart The u chart is mathematically equivalent to the c chart.
27. Example
28. For January 30:
30. Nonconformity Classification
Critical nonconformities
Indicate hazardous or unsafe conditions.
Major nonconformities
Failure
Minor nonconformities
31. Control Charts for Variables vs. Charts for Attributes
Sometimes, the quality control engineer has a choice between variable control charts and attribute control charts.
32. Advantages of attribute control charts Allowing for quick summaries, that is, the engineer may simply classify products as acceptable or unacceptable, based on various quality criteria.
Thus, attribute charts sometimes bypass the need for expensive, precise devices and time-consuming measurement procedures.
More easily understood by managers unfamiliar with quality control procedures.
33. Advantages of variable control charts More sensitive than attribute control charts.
Therefore, variable control charts may alert us to quality problems before any actual "unacceptables" (as detected by the attribute chart) will occur.
Montgomery (1985) calls the variable control charts leading indicators of trouble that will sound an alarm before the number of rejects (scrap) increases in the production process.