Download
1 / 15
150 likes | 291 Views
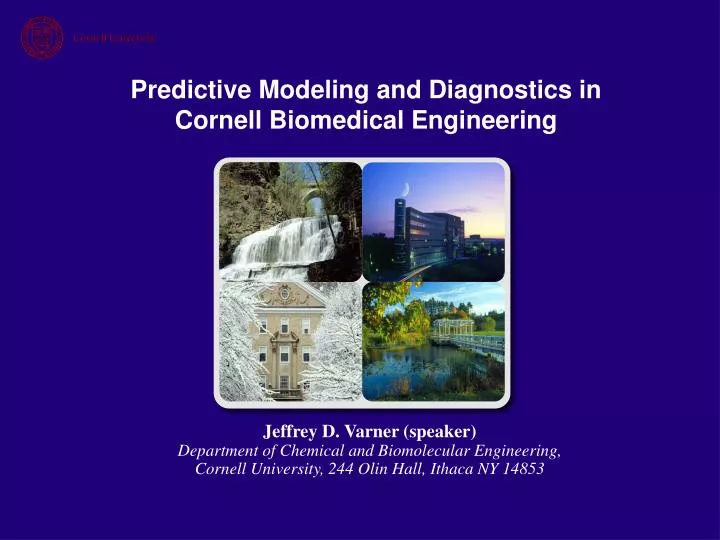
Predictive Modeling and Diagnostics in Cornell Biomedical Engineering. Jeffrey D. Varner (speaker) Department of Chemical and Biomolecular Engineering, Cornell University, 244 Olin Hall, Ithaca NY 14853. Working hypothesis:

E N D
Predictive Modeling and Diagnostics in Cornell Biomedical Engineering • Jeffrey D. Varner (speaker) • Department of Chemical and Biomolecular Engineering,Cornell University, 244 Olin Hall, Ithaca NY 14853
Working hypothesis: Uncertain mathematical models of protein-protein and protein-DNA networks relevant to human health can be computationally screened for fragile mechanisms. Fragile mechanisms represent potential therapeutic targets.
Man-made and evolved networks and systems maybe highly optimized or robust to certain perturbations and sensitive or fragile to others (Highly Optimized Tolerance) If we knew how and where cell logic could break, perhaps even on a patient specific basis, what could we do? Csete et.al., Trends in Biotechnology, 22:446 - 450, 2004
Cyclin E Cyclin E and Cyclin A [concentration] Cyclin B Time [hr] Mass single cell Cellmass [mass] Time [hr] Novak, B. & Tyson, J. J. Theor. Biol., 230: 563–79, 2004.
m x p matrix of first-order partials with respect to states m x m state selection matrix (diagonal) m x p matrix of first-order partials with respect to parameters m x p matrix of first-order sensitivity coefficients Qualitative protein-protein and protein-DNA network models can be quickly generated, approximately identified* and screened for fragile mechanisms Accumulation (m x 1) model equations (m = 213; p = 380) Mass Balances and Algebraic constraints (m x 1) where p denotes the (p x 1) parameter vector Which parameters are important is calculated by sensitivity analysis. The equation governing the first-order sensitivity coefficients can be obtained by differentiating the model equations with respect to p:
1 The Tyson model predicts: Fragility associated with the translational efficiency, the Ubiquitin Proteasome System (UPS) and E2F activated expression. Are these real? Scaled Overall Sensitivity Coefficient Overall state sensitivity coefficient for parameter j Scaled first-order state sensitivity coefficient 0 Parameter Index (1 - 98) 1 Sum over state and then time Scaled Overall Sensitivity Coefficient Stelling et.al., Proc. Nat. Acad. Sci., 101:13210 - 13215, 2004 0 Sorted Parameter Index (1 - 98)
There are a large number of reports linking deregulation of the Ubiquitin ligase family members with cancer development Nakayama et.al., Nature Rev. Cancer., 6:369 - 381, 2006
Proof-of-concept G1-S checkpoint LNCaP model was developed using qualitative data (190 proteins or protein-complexes and 342 protein-protein and protein-DNA interactions) describing cyclin-D expression following PaCP conformer interaction with HER-2 (A) (C) (B) (D)
How can we build and manage large mechanistic network models? Assemble network models Fragility Analysis - Which mechanisms are likely to break? How can we run better experiments to test the models? Can we simulate multicellular dynamics with ensembles of single cells? How do we model the response of complex tissue? Our working hypothesis is that we can understand complex biology by understanding and assembling simple logical pieces
Assuming fast nutrient transients has allowed us to simulate much larger 3-D grids with the same number of CPUs. z-axis z-axis y-axis y-axis x-axis x-axis Spatial-temporal distribution of breast cancer-cell density after 150K iterations for different parameter values (128 x 128 x 128). Simulations were conducted on NERSC (IBM p575 Power5 111-nodes,888 CPUs) at SLAC using LAM-MPI for communication and the PETSc library for the solution of the nutrient field balances (Galerkin, Krylov space with Jacobi preconditioning).
C A HH17 HH25 D B Microscale Biomechanics of Tissue Elements Predictive Modeling by Tissue Composition Butcher et al, Circ Res 2007; Butcher et al, Phil Tras Royal Soc, 2007
RAV RA CCM LA LA RV LV LV LV IVS 3D Quantitative Modeling of Microscale Vascular Geometries - Morphogenesis Butcher et al, Dev Dyn, 2007
Leaflet Strain, EL 17 A V ET = T/T0 A AV HH17 A In Vivo Strain Measurement C EL = ES +/- EF ES = S/S0 S EF = f(S,T,q) q T1 T2 T3 HH27 LAV B D Non-Invasive Measurement and Predictive Modeling of Small Scale 3D Cardiovascular Function Butcher et al, Circ Res. 2007