Download
1 / 20
200 likes | 328 Views
Mike Coombes and Tony Champion Centre for Urban and Regional Development Studies ( CURDS) Newcastle University Acknowledgements: Simon Raybould & Colin Wymer (CURDS) ESRC/JISC for access to the 2001 Census data plus funding for underlying research from various bodies.

E N D
Mike Coombes and Tony Champion Centre for Urban and Regional Development Studies (CURDS) Newcastle University Acknowledgements:Simon Raybould&Colin Wymer (CURDS) ESRC/JISCfor access to the 2001 Census data plus funding for underlyingresearch from various bodies SECs and the City: do all higher Socio-Economic Class migrants go to London?
Background: positive stories about English cities Evidence from around 2001 in The State of the English Cities led to the headline “our cities are back” BUT have the largest cities other than London achieved real growth or just slowed their relative decline? Much academic focus in spatial economics has been on agglomeration, and policy in Britain now often sees cities as the ‘motors’ of regions Cities clearly are the prime locations for knowledge-rich sectors and also have long been magnets for young and better-qualified people (partly due to housing most of the rapid growth in higher education) The question here is whether large English cities other than London are strengthening their position as talent/knowledge/skill is increasingly seen as the key asset in urban and regional development
Rationale for an approach focussing on migration Although the ‘knowledge economy’ emphasis can be exaggerated, research shows knowledge-rich sectors do tend to accelerate growth Much current economic development policy focusses on the attraction of talented/skilled/creative migrants (cf. the Florida thesis) People with the skills knowledge-rich sectors need are relatively scarce Selective out-migration can reduce the number, and proportion, of the more highly-skilled members of the workforce in an area Migration also has built-in multiplier effects: Loss of population, particularly of the highly-skilled and so better paid, harms the local economy by reducing consumer spend Loss of population reduces municipal fiscal strength, thereby lowering the resources available for economic development activity Population loss can reduce private sector confidence in the area
Approach taken to the analysis reported here First look at trends in, and nature of, migration from[/to] other countries • data limitations are severe, especially on migrants to other countries • no possibility of addressing policy-relevant questions like “is there an increasing net flow of highly-skilled migrants to the large northern cities over the last few years?” • a basic aim here is assessing ‘orders of magnitude’ outside London Second look at migration within the UK: • emphasise the migration of the most highly-skilled groups • analyse at the scale of city regions • contrast the experience of London and the next 5 largest cities [ Manchester Birmingham Glasgow Newcastle Liverpool ] • recognise the factors influencing migration flows (eg. life stage) • reflect on the potential impact of policy on the patterns identified
International migration: what is the evidence? Understanding of migration from abroad can be clouded by controversy over immigration, and is hampered by very inadequate data sources: measures of in/out migrant skill-levels depend on the IPS which has such a small (and questionably representative) sample that no data can be derived for cities smaller than London more geographical breakdown possible with other sources, but none of them capture data on out-migrants so net migration is unknowable inconsistencies between data sources arise due to some not following international guidance that migrants (intend to) stay at least a year debate surrounds the quality of key datasets such as that on migrants from “A8/A10” [new EU member countries in central/eastern Europe] of course, there is no information on illegal immigrants
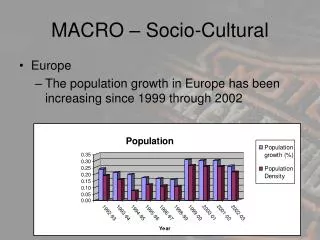
London & SE England attract international migrants London has an annual net inflow of 50,000-100,000 international migrants, over half of England’s total in most years
Different migrants groups go to different areas Contrasting types of migrants differ in economic development impacts: • the highly skilled are prized, but many move within a corporation and are unlikely to respond directly to local policy initiatives? • increasing numbers stay only short periods (even ‘gap’ years): here the challenge is to identify the talented and get them to settle • some are desperate to settle (eg. refugees, or those joining families): countries like Britain are now more selective, aiming to curb rises in the dependency rate, and raise productivity by raising skill levels Recently there was a rapid rise in net in-migration largely stemming from the “A8” countries; some of these mostly shorter-term migrants are highly skilled but took low SEC jobs (as ‘gap’ year travellers do): a key issue here is WHERE the different migrants have gone...
A8 migrants are more willing to go beyond London Migrant location, grouped by labour market size
International migration: summary of implications Policy intervention may be unable to have much effect on these flows International flows of highly skilled people target areas of growth (whilst the A8 inflows – unprecedented in size – had a very different distribution because they spread to rural and less prosperous areas due to taking low SEC jobs, though some A8 migrants highly skilled) Almost all policy instruments relevant to international migration are far beyond the influence of cities or regions in Britain: for example, Scotland has a “Fresh Talent” initiative but even it cannot influence key decisions (eg. to have the new UK points-based immigration system award more points to migrants moving to Scotland) The data available suggests that only overseas students migrate into large cities other than London in large numbers; the overall impact on the labour force in these cities is insufficient to make up for any continuation of the ‘brain drain’ of high SEC people within the UK
Migration flows within the UK are critical for cities International migrants are unlikely to make up a major part of the high skill labour force large cities need to build a knowledge economy, although for London the international inflows are very substantial If cities other than London see a continuing ‘brain drain’ (to London?) then they may be trapped in a low skill equilibrium, with few local jobs requiring high skills and so relatively few high SEC people are attracted or stay if there are good opportunities elsewhere The analyses below use Metropolitan Counties & Greater London first, then a set of City Regions (CRs), so as to examine the broad labour market areas around cities which high SEC people commute across Trends are examined first, then the 2001 Census is analysed because this is the only data on SEC-specific migration flows between CRs
Past research related to cities and migration Counterurbanisation literature is important, but not all relevant to the focus here on long-distance migration, especially thatbetween CRs ALSO datasets on English migrant flows rarely allow for analyses that separatelocal & longer-distance flows and also calculateinflows & outflows(hence net flows) and also distinguishdifferent population groups (eg. by age and skill level) BUT migrant motivation varies hugely bythese breakdowns SO empirical analyses often only indirectly address key policy issues IN GENERAL: * migration rates vary through economic cycles * rates highest for students, then for other young adults, and especially professionals * fewer than 10% of moves – mainly job-related ones – are 200km(+)
Many factors driving migration ‘work against’ cities Research on the UK by Champion et al (1998) & Fotheringham et al (2002) identified factors which attract or deter migrants [ RED = tend to work against cities ] Demographic all age groups bar young adults favour rural living Cultural areas attracting migrants house fewer non-White people but also higher levels of deprivation Environment migrants go to attractive places (many listed buildings) and areas with lower crime rates and better air quality Housing most people aspire to owner occupation migrants tend to go where house prices are higher Labour marketmigrants seek areas with fewer unemployed of their age but also lower employment growth Policy migrants favour areas with lower Council Tax levels Taking all this into account, it is no surprise large cities find attracting and retaining migrants a challenge so London can be seen as all the more exceptional if it succeeds despite its huge size disadvantage
Analyses here build upon a long series of earlier CURDS research studies27 large British city regions:the large citiesin greythe rest of these city regionsin whiterest of Britain (the other 16 city regions) in pale blue
2001 Census data for migration analyses Migration data from the Census only covers the c.10% of people who had changed address in the 12 months before Census day Impossible to measure ‘households’ in the way which would be ideal (ie. to set households numbers against dwelling numbers) 2001 Census “moving group” data is the nearest to household data; the key socio-economic class (NS-SEC) characteristic is given for data on each Moving Group’s Reference Person (MGRP) Students are an important feature of the 2001 data, especially of the moving groups (where a family of 4 = 1 group = 1 student) No information on any characteristics pre migration (which would have meant recently graduating students could be identified)
Age shapes the migration evidence very strongly The 5 large CRs in the north gain a modest inflow of 16-19 year olds each year but twice as many 20-24 year olds are leaving (as are the family age groups from London too)
London is a focus of geographic and social mobility London has its highest in/out ratios for the most high skill groups: the 5 large CRs in the north have their most negative in/out ratios for the most highly skilled groups
Flows between London CR and the other big cities show their direct loss of skilled labour to the capital The big cities here are defined in terms of fully built-up areas(eg. for Newcastle it is all Tyneside)
Conclusions from internal migration analysisand policy questions Few cities gained population from within-UK migration: can a more widespread urban renaissance be generated? London attractedmany more Higher M&Ps than other large cities did: how can more cities attract/keep this key group? Students moving to university boost most cities’ populations, but the loss of recent graduates weakens their growth potential: what can improve graduate retention in provincial cities? Most cities making strong gains from migration have had both local job growth and have attributes of a higher quality of life: can quality of life advantages compensate for persistent lower economic growth so that northern large cities can attract migrants?