Download
1 / 26
260 likes | 394 Views
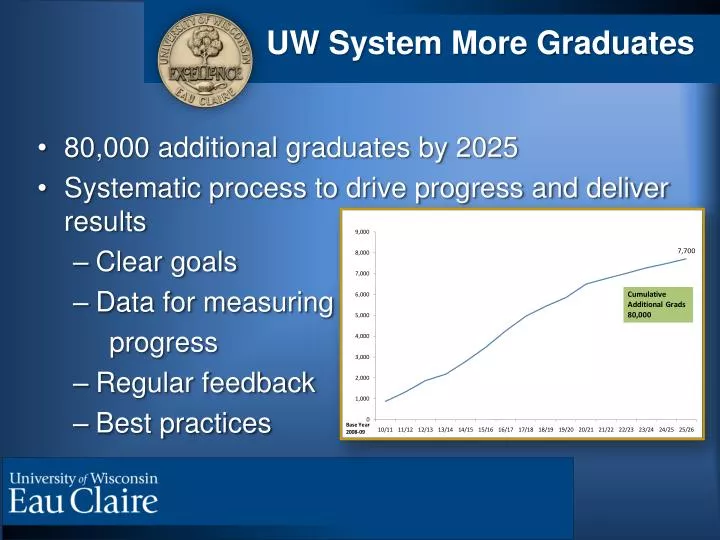
UW System More Graduates. 80,000 additional graduates by 2025 Systematic process to drive progress and deliver results Clear goals Data for measuring progress Regular feedback Best practices. Impact Points.

E N D
UW System More Graduates • 80,000 additional graduates by 2025 • Systematic process to drive progress and deliver results • Clear goals • Data for measuring progress • Regular feedback • Best practices
Impact Points Retention Rates Graduation Rates (New Freshmen & (New Freshmen & H.S. Grad Rates Transfers) Transfers) K-12 H.S. Graduation Higher Education College Degree # of Graduates # of Degrees College Transfer Going Rates Rates Populations of Opportunity: -Adult Students -Students of Color -First Generation Students -Low-Income Students
Initial Commitments 2025 goals with milestones at 2015 and 2020 A2S commitment to cut gaps in half by 2015 imbedded in each campus plan Minimum of 3% point gain in retention and graduation rates on each campus Annual accountability report Plans and targets revisited annually to adjust for changing conditions
Improve Results More Graduates for Wisconsin Offer Alternative Pathways Enhance the Pipeline Increase Enrollment
University of Wisconsin – Eau Claire Evidence-based Higher Education Administration: the University of Wisconsin – Eau Claire Experience Michael R. Wick Associate Vice Chancellor for Academic Affairs Patricia A. Kleine Provost and Vice Chancellor for Academic Affairs
Telling Our Story “…all _____ courses require writing and analysis, and ____faculty engage in pedagogy to support active learning to the extent possible…” “…the study of _____ is inherently transformational…” “… _____ has a longstanding tradition of quality instruction and a demonstrated commitment to transformative student learning … at the departmental level, over the past year we have been working on some major curricular revisions intentionally designed to create a learning experience for our majors that is progressive, relevant, and dynamic…” “____ enjoys an excellent reputation as a teaching and advising department…”
Inspiration & Experimentation Climate Survey The Delaware Study Equity Scorecard
Our Path to “Evidence-Based” High Veracity Low Veracity Low Stakes High Stakes
Experience II:Compass Psychology Of Women Research Apprentice
Zoomed View Experience II:Growth Agenda
Experience-Informed Degree Audit/Transcript Analysis
Speculative Indicators • Student Engagement
Preliminary Leading Indicators@ Eau Claire Four-Year Graduation Rate
CL Math Four-Year Graduation Rate Advising Initiative Self-Paced Modules with Care Center Support Students Retained to 3rd Year
Completed 60+ Credits in First Two Years Four-Year Graduation Rate Advising Initiative Needs More Investigation
Progress to Date Educational Attainment
Lessons Learned • Use “big picture” ideology to overcome faculty criticism of data and data collection process. • Empower faculty to draw conclusions from the data rather than having those conclusions drawn centrally. • Connect the data to the value system of the faculty. • Share the data widely and openly. • Be prepared to be evidence-based in all initiatives.
Questions Michael R. Wick Associate Vice Chancellor for Academic Affairs University of Wisconsin – Eau Claire wickmr@uwec.edu