Download

1 / 20
200 likes | 344 Views
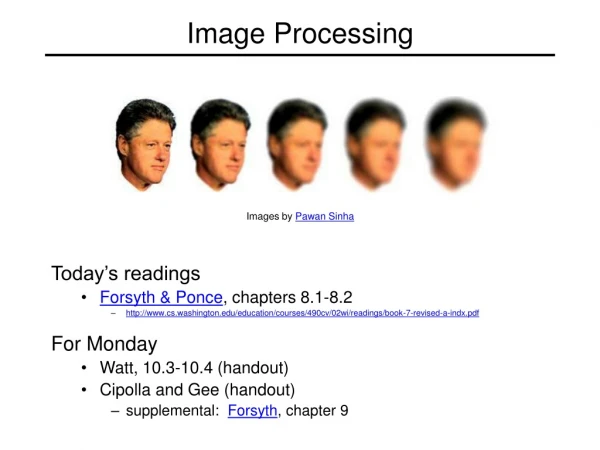
Image Processing. Lecture 6 . Not discussed before Zoom K factor. Image header. Note: As the number of gray levels decreases, we can see increase in a phenomenon called contouring.

E N D
Image Processing Lecture 6
Not discussed before • Zoom K factor. • Image header
Note: • As the number of gray levels decreases, we can see increase in a phenomenon called contouring. • Contouring appears in the image as false edges, or lines as a result of the gray _level quantization method.
Edge Detection Detecting edges is a basic operation in image processing. The edges of items in an image hold much of the information in the image. The edges tell you where: • items are. • their size. • shape • and something a bout their texture. Edge detection methods are used as a first step in the line detection processes, and they are used to find object boundaries by marking potential edge points corresponding to place in an image where rapid changes in brightness occur. After these edge points have been marked, they can be merged to form lines and objects outlines.
Edge detection operations are based on the idea that edge information in an image is found by looking at the relationship a pixel has with its neighbors. If a pixel gray_level values similar to those a round it, there is probably not an edge at that point at that point. However, if a pixel has neighbors with widely varying gray levels, it may represent an edge point. In other words, an edge is defined by a discontinuity in gray-level values. Ideally, an ege separates two distinct objects. In practice, edges are caused by: • Change in color or texture or • Specific lighting conditions present during the image acquisition process.
The following figure illustrates the difference between an ideal edge and a real edge.
The vertical axis represents brightness, and the horizontal axis shows the spatial coordinates. The abrupt change in brightness characterizes an ideal edge. In the figure (b) we see the representation of real edge ,which change gradually. This gradual change is a minor form of blurring caused by: • Imaging devices • The lenses • Or the lighting and it is typical for real world (as opposed to computer _generated) images. An edged is where the gray level of the image moves from an area of low values to high values or vice versa. The edge itself is at thecenterof this transition. The detected edge gives a bright spot at edge and dark area every where else. This mean it is the slope or rate of change of the gray level in the edge.
How do you calculate the derivative (the slop) of an image in all direction? Convolution of the image with masks is the most often used techniques of doing this. The idea is to take a 3×3 array of numbers and multiply it point by point with 3×3 section of the image you sum the products and place the result in the center point of the image. The question in this operation is how to choose the 3×3 mask? There are several masks that amplify the slop of the edge. Take the simple one-dimensional case and take as an example points on the ideal edge near the edge. They could have values such as [3 5 7]. The slop through these three points is (7-3)/2=2.if you convolve these three point with [-1 0 1] you have -3+7=4.
The convolution amplified the slope, and the result is a large number at the transition point in the edge. There are two basic principles for each edge detector mask: • First: the number in the mask sum to zero. If 3×3 areas of an image contains a constant value (such as all ones), then there are no edges in that area. The result of convolving that area with a mask should be zero. If the numbers in the mask sum to zero, then convolving the mask with a constant area will result in the correct answer of zeros. • Second: the masks should approximate differentiation or amplify the slope of the edge. The simple example [-1 0 1] given earlier showed how to amplify the slope of the edge.
The number of masks used for edge detection is almost limitless. Research have used different techniques to derive masks, some of will be illustrated in the following section. 1- Sobel Operator: The Sobel edge detection masks look for edges in boththe horizontal and vertical directions and then combine this information into a single metric. The masks are as follows:
These masks are each convolved with the image. At each pixel location we now have two numbers: s1 corresponding to the result from the row mask ,and s2 from the column mask. we uses these magnitude to compute two metrics , the edge magnitude, and the edge direction which are defined as follows
2. Prewitt Operator the Prewittt operator is similar to the sobel , but with different maskcoefficient . the masks are defined as follows: row mask column mask These masks are each convolved with the image. At each pixel location we now have two numbers:p1corresponding to the result from the row mask ,and p2 from the column mask. we uses these result to determined two metrics
Ex:- apply Sobel operation for edge detection -3-18-7+1+16+6= - 5 S1 -3+7-4+6-1+6 = -5 S2
Edgedirection =7 Edge direction Tan -1[-5/11]=0.05
3. Kirsch Compass Masks the Kirch edge detection masks are called compass mask s because they are defined by taking a single mask and rotating it to the eight major compass orientations : north, north-east, east, south-east, south, south-west, and west and northwest edges in an image. The masks are defined as later: K0 K1 K2 K3 K4 K5 K6 K7
The edge magnitude is defined as the maximum value found by the convolution of each of the mask, with the image. [Given a pixel, there are eight directions you can travel to a neighboring pixel (above, below , left ,right ,upper left, upper right, lower left, lower right). Therefore there are eight possible directions for an edge. The directional edge detectors can detect an edge in only one of the eight directions. If you want to detect only left to right edges, you would use only one of eight masks. If; however you want to detect all of the edges, you would need to perform convolution over an image eight times using each of the eight masks]. K0*F2=S0 K1*F2=S1 K2*F2=S2 K3*F2=S3 : : : K7*F2=S7 K0*F1=S0 K1*F1=S1 K2*F1=S2 K3*F1=S3 : : : K7*F1=S7 \\\\\\ F1 F2
5. Robinson Compass Masks the Robinson compass masks are used in a manner similar to the Kirch masks but are easier to implement because they rely only on coefficient of 0,1 and 2, and are symmetrical about their directional axis-the axis with the zeros, we only need to compute the result on four of the mask, the results. From the other four can be obtained by negating the results form the first four. The masks are as follows: R0 R1 R2 R3 R4 R5 R6 R7
The edge magnitude is defined as the maximum value found by the convolution of each of the masks with the image. The edge detection is defined by the mask that produces the maximum magnitude. It’s interesting to note that masks R0 and R6 are the same as the Sobel masks. We can see that any of the edge detection masks can be extended by rotating them in a manner like these compass masks which allow us to extract explicit information about edge in any direction. Magnitude Of Edge= Max Value Of Mask Convolution Direction Of Edge= Is The Direction Of Maximum Value