Download
1 / 135
1.35k likes | 1.46k Views
Number of Workers (millions). The table shows the number of workers , in millions,. 778. 472. 147. 106. 82. China. India. U.S. Indonesia. Brazil. Country. Number of Workers (millions).

E N D
Number of Workers (millions) The table shows the number of workers, in millions, 778 472 147 106 82 China India U.S. Indonesia Brazil Country
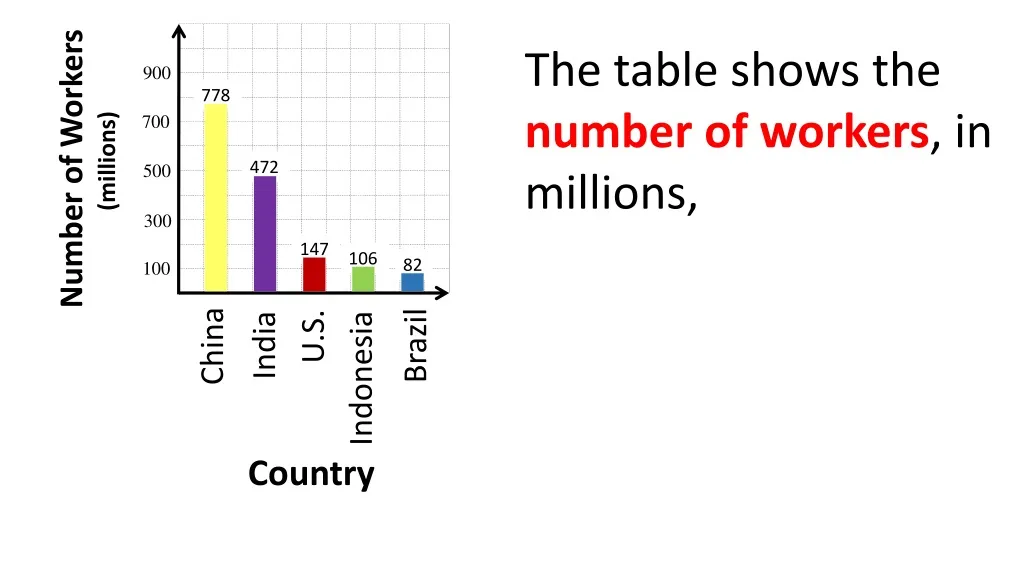
Number of Workers (millions) The table shows the numberofworkers, in millions, for the five countries with the largest labor forces. 778 472 147 106 82 China India U.S. Indonesia Brazil Country
Number of Workers (millions) The table shows the numberofworkers, in millions, for the five countries with the largest labor forces. 778 472 147 106 82 China India U.S. Indonesia Brazil Find the standard deviation. Country
Number of Workers (millions) The table shows the numberofworkers, in millions, for the five countries with the largest labor forces. 778 472 147 106 82 China India U.S. Indonesia Brazil Find the standard deviation. Country
Number of Workers (millions) The table shows the numberofworkers, in millions, for the five countries with the largest labor forces. 778 472 147 106 82 China India U.S. Indonesia Brazil Find the standard deviation. Country
Number of Workers (millions) The table shows the numberofworkers, in millions, for the five countries with the largest labor forces. 778 472 147 106 82 China India U.S. Indonesia Brazil Find the standard deviation. Country
Number of Workers (millions) The table shows the numberofworkers, in millions, for the five countries with the largest labor forces. 778 472 147 106 82 China India U.S. Indonesia Brazil Find the standard deviation. Country
Number of Workers (millions) The table shows the numberofworkers, in millions, for the five countries with the largest labor forces. 778 472 147 106 82 China India U.S. Indonesia Brazil Find the standard deviation. Country
Number of Workers (millions) The table shows the numberofworkers, in millions, for the five countries with the largest labor forces. 778 472 147 106 82 China India U.S. Indonesia Brazil Find the standard deviation. Country
The mean is 317. Now find by how much each of the five data items differs from 317.
The mean is 317. Now find by how much each of the five data items differs from 317.
The mean is 317. Now find by how much each of the five data items differs from 317.
The mean is 317. Now find by how much each of the five data items differs from 317.
The mean is 317. Now find by how much each of the five data items differs from 317.
The mean is 317. Now find by how much each of the five data items differs from 317.
Add the squared deviations. Totals:
Add the squared deviations. Totals:
Add the squared deviations. Totals:
Add the squared deviations. Totals:
Add the squared deviations. Totals:
Divide the sum by n – 1 Totals:
Divide the sum by n – 1 Totals:
Divide the sum by n – 1 Totals:
Divide the sum by n – 1 Totals:
Divide the sum by n – 1 Totals:
Divide the sum by n – 1 Totals:
Divide the sum by n – 1 Totals:
Divide the sum by n – 1 Totals:
Divide the sum by n – 1 Totals:
Divide the sum by n – 1 Totals:
Divide the sum by n – 1 Totals:
Divide the sum by n – 1 Totals:
Divide the sum by n – 1 Totals: