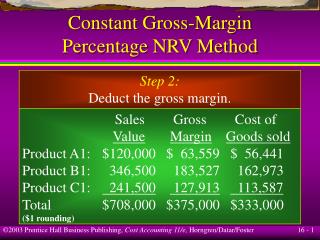
Download
1 / 27
270 likes | 384 Views
Measuring Gross Regional Domestic Product: The Philippine Experience by MARIA FE M. TALENTO Division Head Production Accounts Division National Statistical Coordination Board International Workshop Regional Products and Income Accounts Tiantan Hotel, Beijing China 15 -17 March, 2010.

E N D
Measuring Gross Regional Domestic Product: The Philippine Experience by MARIA FE M. TALENTODivision Head Production Accounts Division National Statistical Coordination Board International Workshop Regional Products and Income Accounts Tiantan Hotel, Beijing China 15 -17 March, 2010
OUTLINE OF PRESENTATION Introduction Compilation Process: Gross Regional Domestic Product (GRDP) of the Philippines Sources of Data Estimation Methodology Development Efforts Issues on the GRDP Current Improvements Next Steps
I. INTRODUCTION • The Philippine Statistical System (PSS) • A highly decentralized statistical system: - statistics are produced by a number of major producers of primary data and by smaller units in all levels of government which generates statistics as a by-product of their administrative or regulatory functions
I. INTRODUCTION • The Current Gross Regional Domestic Product (GRDP) • follows the 1968 UNSNA but to a limited extent already incorporates the recommendations of the 1993 SNA. • a Designated Statistics under Executive Order No. 352 and is currently being developed and maintained by the National Statistical Coordination Board (NSCB)
I. INTRODUCTION • Milestones in GRDP estimation: • 1974 – first compilation of the GRDP for the period 1971-1974 • 1978 – GRDP compilation was resumed and institutionalized • Data Series of GRDP: 1978-2008 • Coverage of GRDP: • 17 regions • Date of Release of GRDP: • Every first Thursday of August of the current year
II. COMPILATION PROCESS • The current GRDP is compiled by industrial origin: • Agriculture, Fishery and Forestry • Agriculture • Forestry • Industry • Mining and Quarrying • Manufacturing • Construction • Electricity and Water
II.COMPILATION PROCESS • The current GRDP is compiled by industrial origin: 3. Services • Wholesale and Retail Trade • Transportation, Communication and Storage (TCS) • Finance • Ownership of Dwellings and Real Estate (ODRE) • Private Services • Government Services
II.COMPILATION PROCESS • GRDP Measurement : uses the production approach: - Unduplicated sum of all the goods and services produced in the regional economy (by resident producers), valued at producers’ • prices GRDP (P) = Gross Value Added (GVA) by industry, by region
II. COMPILATION PROCESS • Top to Bottom Approach: - National control total by sector is allocated by region - data support is stronger at the national level
II. COMPILATION PROCESS • The NSCB is in the process of devolving the estimation of the GRDP to the NSCB Regional Offices: - the NSCB Central Office estimates the GRDP by sector for all 17 regions using the national level as control total. - Simultaneously, the 9 NSCB regional offices come up with an independent estimate of their region’s GDP by sector using available data and indicators from their respective regions
II. COMPILATION PROCESS • Estimates of the Central Office and the NSCB Regions go through a deliberation process by sector by region (validation of data, major developments in the region, etc.) • The final estimates are reached, in consensus with the NSCB Regions after incorporating all considerations in the deliberation process. • Independent estimates from the regions, however, will not add up to the national total • National total by sector is allocated to the Regions using percentage distribution.
III. SOURCES OF DATA • Census/Survey-based data • - Census of Phil. Business & Industry (CPBI) • - Annual Survey of Phil. Business & Industry (ASPBI) • - Quarterly Survey of Phil Business & Industry (QSPBI) • Administrative-based data • Special Studies • Indicators from Industry Associations (i.e., Chamber of Mines, Cement Manufacturers Assn. of the Philippines, etc.)
IV. Current Price Estimation: by region • Indirect Approach: Use of GVARs • GVA = Gross Output * Gross Value Added • Ratio (GVAR) • where: • GVAR = Gross Value Added • Gross Output • Sectors: Agriculture, Fishery and Forestry, Mining and Quarrying
IV. Current Price Estimation: by region • Value Extrapolation • GVAt = previous GVA level t-1 * growth rate of • the value of productiont /t-1 • Example: Services sectors – value extrapolation using the trend of gross revenue from the Quarterly Survey of Phil Business and Industry (QSPBI)
IV. Constant Price Estimation: by region • Uses the fixed-base year method: • Single Deflation: GVAk = GVAt /Deflator • Quantity Revaluation: GVAk = (Qtyt * Price at base year)*GVAR • Volume Extrapolation: GVAk = GVA level t-1 * 1+ GR rate of volume or output indicator/t-1
V. DEVELOPMENT EFFORTS • Addressing increasing demand for local level statistics: • pilot compilation of the Provincial Product Accounts for the provinces of Palawan in 1998 and Guimaras in 2006
V. DEVELOPMENT EFFORTS • ADVANCE RELEASE CALENDAR: NSCB has adopted a policy of releasing in advance the schedule of press releases for the national accounts & its related accounts including the GRDP • Forging of partnerships with source agencies • - bilateral meetings, Task Forces
V. DEVELOPMENT EFFORTS • Supplementary data from the private sector: • - financial statement of companies • - gross revenue of top food chains • - volume and value of utilities • - Indicators from industry associations • Incorporated emerging industries such as the Business Process Outsourcing (BPO) in GRDP beginning 2003
V. DEVELOPMENT EFFORTS • Use of NSCB website to inform the public: • Press Releases, Announcements on the GRDP • Technical Notes on the GRDP • Metadata on the GRDP • Advance Release Calendar on National Accounts and its Related Accounts • Regional Fact Sheets • Response to erroneous GRDP reports from the media
VI. ISSUES • Data Problems • Data support at the regional level • Frequent revision of regional compositions • Time lag of data sourcesSurvey/Census results, Price indices, etc. • Need to update/improve parameters Ratios used in estimation i.e., GVAR, undercoverage ratios
VI. ISSUES • Coverage • Emerging Industries • Births and deaths of establishments • Undercoverage of illegal activities • Undercoverage of own-account production
VI. ISSUES • Some Measurement Problems • Regional allocation of output -Economic activities such as Fishing, Transportation and Communication industries which extend beyond regional boundaries -Problem of allocating the cost of operations of the head office for companies with regional branches • Regional estimates of the informal sector
VI. ISSUES • RESOURCES • Manpower - fast turnover of national accounts staff in the central office - need for training on National Accounts for NSCB personnel in the Regions - need for the NSCB Central Office staff to revive visits to the regions for validation of estimates
VI. ISSUES • RESOURCES • Software for GRDP Compilation: • -need to upgrade current hardware and • software resources • - need to refine the existing computerized • GRDP compilation • Financial Resources for statistical activities:limited budget given to censuses and surveys; Statistical offices always get low priority in the allocation of resources
VII. CURRENT IMPROVEMENTS • Over-all Revision/Rebasing of the GRDP • Revised/rebased 1998-2009 series • Implementation of 1993 SNA Concepts • Shift in base year to 2000 & eventually 2006 • Improvement in Data and Methodology • Refinements in the computerized compilation of the GRDP • Date of Release: September 2010
VIII. NEXT STEPS • Compilation of City/Provincial Product Accounts • Provision of training to Compilers and Data Producers • Policy on Overall Revision/Rebasing of the GRDP
Maraming Salamat Po! URL: http://www.nscb.gov.ph e-mail: info@nscb.gov.ph