Download
1 / 32
320 likes | 328 Views
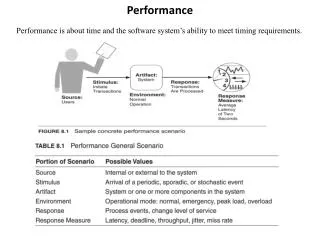
Performance. Parameters that affect it How to improve it and by how much. Performance. User – response time Manager - throughput. Throughput. Total amount of work done in a given time. A system administrator would like to increase the throughput. Increase performance implies

E N D
Performance Parameters that affect it How to improve it and by how much
Performance • User – response time • Manager - throughput
Throughput • Total amount of work done in a given time. • A system administrator would like to increase the throughput. Increase performance implies increase throughput, decrease execution time
Performance • Response time/Execution time/Turn-around time/Latency/Wall-clock time/Elapsed time • Time between the start and completion of a task. • Users are normally interested in reducing this parameter. • Includes • CPU execution time for this task. • I/O time spent waiting to bring in program’s text and data. • I/O time spent waiting to access memory. • CPU time consumed by other programs. • CPU time consumed by the OS.
CPU execution time/CPU time CPU execution time • User CPU time - Time spent on the user program and library sub-routines. • System CPU time - Time spent in running system calls invoked by the program.
System performance refers to Response time. • CPU performance refers to CPU execution time.
Performance vs Execution time • Performance (P) = 1/ tE • If X is ‘n’ times faster than Y, it implies: Px/Py = n = tEy/tEx i.e. Y times takes ‘n’ times longer than X.
Example 1 If a machine A runs a program in 10 seconds and machine B runs the same program in 15 seconds, how much faster is A than B? • n = PA/PB • = tB/tA • = 15/10 • = 1.5 • A is 1.5 times faster than B
CPU performance equation • User measures in seconds. • Designer measures in number of clock cycles. CPU time = CPU clock cycles * cycle time = CPU clock cycles / clock rate
CPU time = CPU clock cycles * cycle time • = CPU clock cycles / clock rate • 10 = CPU clock cycles for A * 1/400 MHz • = CPU clock cycles for B * 1/800 MHz • CPU clock cycles for B = 1/400 * 6 = 1.2 • CPU clock cycles for A 1/800 * 10 Example 2 Computer A has a 400 MHz clock and runs a program in 10 seconds. Computer B has a 800 MHz clock and runs the same program in 6 seconds. The increase in the clock rate of B implies an increase in the number of clock cycles required by B. Determine by how much the number of clock cycles in computer B has increased to allow for the higher clock rate.
CPU Performance equation CPU clock cycles = IC * CPI • IC: instruction count (number of instructions per program) • CPI: average cycles per instruction • CPU time = IC * CPI * cycle time
seconds = instructions * clock cycles * seconds • program program instruction clock cycle • = 4298 x 2.9 x 1/(2.7 x 109) • CPU time = 4.26 x 10⁻⁶ seconds Example 3 Given a machine M1 with a clock rate 2.7GHz, how long will a program P1 take to run if there are 4,298 instructions and each instruction takes an average of 2.9 cycles.
CPU time = IC * CPI * cycle time Perf of M1 / Perf of M2 = (IC2 * CP2 /Clock rate2) (IC1 * CPI1 /Clock rate1) = (CPI2 * Clock rate1) (CPI1 * Clock rate2) = (3.2 * 2.7GHz) / (2.9 * 3.1GHz) = 0.96 M2 is 1/0.96=1.04 times faster than M1. Example 4 Given P1 and M1 from previous problem, what is the relative performance of M1 with respect to a machine M2 having clock rate 3.1 GHz running P1, where each instruction of P1 on M2 requires 3.2 cycles instead of 2.9 cycles?
CPI • CPI – Average clock cycles per instruction. • CPU clock cycles = Σi (CPIi * ICi) • ICi : count of instructions of class i • CPIi : cycles that takes to execute instructions of class i • CPI = CPU clock cylces/# of instructions
Example 5a Given the following instruction mix and the frequency of occurrence of the instruction types, determine the CPI. CPI = .5 * 4 + .2 * 5 + .1 * 4 + .2 * 3 = = 4
Example 5b Given a machine M1 with clock rate 2.9 GHz, how long will a program P1 take to run that has 5,728 instructions and the instruction mix as shown in the previous problem? 5,728 * 4 Exec. Time of P1 on M1 = ______________ 2.9 * 10^9 Exec. Time of P1 on M1 = 7.9 x 10⁻⁶ seconds = 7.9 micro-seconds
Example 6 • Comparing two compiler code segments • Which code sequence executes the most instructions? • Which sequence will require fewer CPU clock cycles to execute?
Instruction count • S1 : 2 + 1 + 2 = 5 • S2 : 4 + 1 + 1 = 6 • S1 executes fewer instructions than S2 • To determine CPI • CPU clock cycles = Σi (CPIi * ICi) • S1 : CPU clock cycles = (2 x 1) + (1 x 2) + (2 x 3) = 10 cycles • S2 : CPU clock cycles = (4 x 1) + (1 x 2) + (1 x 3) = 4 + 2 + 3 = 9 cycles • S2 requires fewer clock cycles than S1.
Scope of Performance Sources CPU time =IC* CPI *Cycle time Program Compiler ISA Organization Hardware
Choosing Programs To Evaluate Performance Levels of programs or benchmarks that could be used to evaluate performance: • Actual Target Workload: Full applications that run on the target machine. • Real Full Program-based Benchmarks: • Select a specific mix or suite of programs that are typical of targeted applications or workload (e.g SPEC95, SPEC CPU2000). • Small “Kernel” Benchmarks: • Key computationally-intensive pieces extracted from real programs. • Examples: Matrix factorization, FFT, tree search, etc. • Best used to test specific aspects of the machine. • Microbenchmarks: • Small, specially written programs to isolate a specific aspect of performance characteristics: Processing: integer, floating point, local memory, input/output, etc.
Types of Benchmarks Cons Pros • Very specific. • Non-portable. • Complex: Difficult • to run, or measure. • Representative Actual Target Workload • Portable. • Widely used. • Measurements • useful in reality. • Less representative • than actual workload. Full Application Benchmarks • Easy to “fool” by designing hardware to run them well. Small “Kernel” Benchmarks • Easy to run, early in the design cycle. • Peak performance results may be a long way from real application performance • Identify peak performance and potential bottlenecks. Microbenchmarks
SPEC: System Performance Evaluation Cooperative The most popular and industry-standard set of CPU benchmarks. • SPECInt92 (6 integer programs) and SPECfp92 (14 floating point programs). • SPEC95, 1995: • SPECint95 (8 integer programs), • SPECfp95 (10 floating-point intensive programs): • SPEC CPU2000, 1999: • CINT2000 (11 integer programs). CFP2000 (14 floating-point intensive programs)
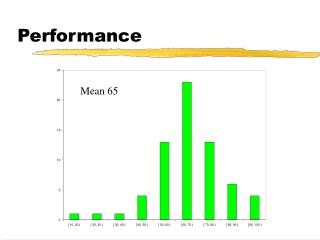
Relative performance • Total time: Σ exec timei • Arithmetic mean: AM = 1/n * Σ exec timei • Programs in the workload are each run an equal number of times. • Weighted mean: WM = Σ wi * exec timei • If the programs in the workload are not each run an equal number of times.
Arithmetic Mean 1180 1180 1180
Weighted Arithmetic Mean 380 695 seconds seconds
Example 7 • A program runs for 100s and 80% of the operations are multiplications. By how much should the multiplication operation be speeded up so that the program can be 5 times faster? tE (Un-enhanced) = 100s Desired (with improved multiplications) tE = 100/5 = 20s tE (Enhanced) = (100 – 80) + time for multiplications => 20 = 20 + time for multiplications This implies that no matter how much the multiplications are improved, tE cannot be enhanced by 5 times, when the multiplications account for only 80% of the operations.
Amdahl’s law • The performance improvement that can be obtained from using a faster mode of execution is limited by the fraction of time that the faster mode can be used.
Amdahl’s law • Overall Speedup = PEnhanced/PUnenhanced = tUnenhanced/tEnhanced Depends on two factors: • f – fraction of execution time that can be enhanced. • s – speedup obtained for the fraction
Amdahl’s equation Overall Speedup =
Example 8 • Let’s say that your processes spend 70% of their time running in the CPU and 30% waiting for service from the disk. You have the option to upgrade to a CPU that is 50% faster than your current CPU or to a set of disk drives that promise to be two and a half times faster than your current drives. Which upgrade would you choose?
CPU upgrade : f = 0.7 s = 1.5 Overall speedup = Disk drive upgrade : f = 0.3 s = 2.5 Overall speedup = CPU upgrade cost = $10,000 Disk drives upgrade cost = $7,000 and if cost is a concern, which would you choose? 1% of CPU upgrade => $10000/30 = $333 1% of disk drive upgrade => $7000/22 = $318