Download
1 / 54
540 likes | 677 Views
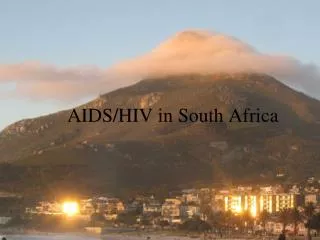
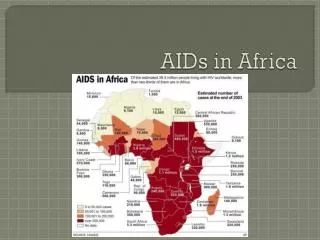
AIDS IN AFRICA Public Policy Challenges Joel Samoff. Adults and children estimated to be living with HIV/AIDS as of end 2001. Eastern Europe & Central Asia 1 million. Western Europe 560 000. North America 940 000. East Asia & Pacific 1 million. North Africa & Middle East 440 000.

E N D
Adults and children estimated to be living with HIV/AIDS as of end 2001 Eastern Europe & Central Asia 1 million Western Europe 560 000 North America 940 000 East Asia & Pacific 1 million North Africa & Middle East 440 000 South & South-East Asia 6.1 million Caribbean 420 000 Sub-Saharan Africa 28.1 million Latin America 1.4 million Australia & New Zealand 15 000 Total: 40 million Total: 40 million
Estimated number of adults and childrennewly infected with HIV during 2001 Eastern Europe & Central Asia 250 000 Western Europe 30 000 North America 45 000 East Asia & Pacific 270 000 North Africa & Middle East 80 000 South & South-East Asia 800 000 Caribbean 60 000 Sub-Saharan Africa 3.4 million Latin America 130 000 Australia & New Zealand 500 Total: 5 million Total: 5 million
Estimated adult and child deaths from HIV/AIDS during 2001 Eastern Europe & Central Asia 23 000 Western Europe 6 800 North America 20 000 East Asia & Pacific 35 000 North Africa & Middle East 30 000 South & South-East Asia 400 000 Caribbean 30 000 Sub-Saharan Africa 2.3 million Latin America 80 000 Australia & New Zealand 120 Total: 3 million Total: 3 million
Children(<15 years)estimated to be living with HIV/AIDS as of end 2001 Eastern Europe & Central Asia 15 000 Western Europe 4 000 North America 10 000 East Asia & Pacific 7 000 North Africa & Middle East 20 000 South & South-East Asia 200 000 Caribbean 20 000 sub-Saharan Africa 2.4 million Latin America 40 000 Australia & New Zealand < 200 Total: 2.7 million Total: 2.7 million
Estimated deaths in children (<15 years) from HIV/AIDS during 2001 Eastern Europe & Central Asia < 100 Western Europe < 100 North America < 100 East Asia & Pacific 1 500 North Africa & Middle East 6 000 South & South-East Asia 40 000 Caribbean 5 000 sub-Saharan Africa 500 000 Latin America 8 000 Australia & New Zealand < 100 Total: 580 000 Total: 580 000
Estimated number of children (<15 years)newly infected with HIV during 2001 Eastern Europe & Central Asia 1 000 Western Europe < 500 North America < 500 East Asia & Pacific 3 000 North Africa & Middle East 12 000 South & South-East Asia 65 000 Caribbean 6 000 sub-Saharan Africa 700 000 Latin America 10 000 Australia & New Zealand < 100 Total: 800 000 Total: 800 000
Cumulative number of children estimated to have been orphaned by AIDS* at age 14 or youngerat the end of 1999 Eastern Europe & Central Asia 500 Western Europe 9 000 North America 70 000 East Asia & Pacific 5 600 North Africa & Middle East 15 000 South & South-East Asia 850 000 Caribbean 85 000 Sub-Saharan Africa 12.1 million Latin America 110 000 Australia & New Zealand < 500 Total: 13.2 million * HIV-negative children who have lost their mother or both parents to AIDS before the age of 15 years
Adult and children estimated to be living with HIV/AIDS as of end 1998 sub-Saharan Africa 22.5 million Global total: 33.4 million World Health Organization UNAIDS–Addis–May 1999
Spread of HIV in sub-Saharan Africa, 1987 Estimated percentage of adults (15–49) infected with HIV 16.0% – 32.0% 8.0% – 16.0% 2.0% – 8.0% 0.5% – 2.0% 0% – 0.5% trend data unavailable outside region World Health Organization UNAIDS–Addis–May 1999
Spread of HIV in sub-Saharan Africa, 1997 Estimated percentage of adults (15–49) infected with HIV 16.0% – 32.0% 8.0% – 16.0% 2.0% – 8.0% 0.5% – 2.0% 0% – 0.5% trend data unavailable outside region World Health Organization UNAIDS–Addis–May 1999
Projected changes in life expectancy in selected African countries with high HIV prevalence, 1995–2000 65 60 55 50 45 40 35 Average life expectancy at birth, in years Botswana Zimbabwe Zambia Uganda Malawi projections 2000 1955 1960 1965 1970 1975 1980 1985 1990 1995 Source: United Nations Population Division, 1996 World Health Organization UNAIDS–Addis–May 1999
Increase in mortality among men 15–60 between 1986 and 1997, selected African countries 80 % Probability of dying from all causes 1995/96 70 60 1994 1993 50 1990/91 1991 1989 1995 40 1986 30 1990 1988 20 10 Country and survey date 0 Zimbabwe Tanzania Malawi Uganda Zambia Source: Timaeus I, London School of Hygiene and Tropical Medicine, from Demographic and Health Survey data World Health Organization UNAIDS–Addis–May 1999
Estimated impact of AIDS on under-5 child mortality rates –Selected African countries, 2010 with AIDS per 1000 live births 250 without AIDS 200 150 100 50 0 Botswana Kenya Malawi Tanzania Zambia Zimbabwe Source: US Bureau of the Census World Health Organization UNAIDS–Addis–May 1999
Orphans due to AIDS, 1990–2010 2.5 Millions South Africa 2.0 1.5 1.0 Zimbabwe 0.5 0 1990 1995 2000 2005 2010 projections Source: Metropolitan Life Scenario 80 UNAIDS–Addis–May 1999
Economic Growth Impact of HIV (1990-97) Figure 2: Growth Impact of HIV (1990-97) (80 developing countries) 0 -0.2 -0.4 -0.6 Reduction in growth rate GDP per capita (%, per year) -0.8 -1 -1.2 -1.4 -1.6 0 5 10 15 20 25 30 35 HIV Prevalence Rate (%) Source: R. Bonnel (2000) Economic Analysis of HIV/AIDS, ADF2000 Background paper, World Bank
Impact of HIV/AIDS on urban households, Côte d’Ivoire General population Families living with AIDS 30 000 Francs CFA 25 000 Monthly income per capita 20 000 15 000 Monthly consumption per capita 10 000 5 000 Savings/Disavings 0 – 5 000 Source: Simulation-based on data from Bechu, Delcroix and Guillaume, 1997 UNAIDS–Addis–May 1999
Expected AIDS treatment costs as a share government health spending 70 % of MOH Budget 60 50 40 30 20 10 0 Ethiopia, 2014 Kenya, 2005 Zimbabwe, 2005 Source: Stover & Bollinger, 1999 UNAIDS–Addis–May 1999
Bed occupancy required for AIDS patients, Zimbabwe 1990 2000 Non-AIDS beds AIDS beds Source : UNAIDS, 2000
AIDS care costs vs. Ministry of Healthand Child Welfare budget – Zimbabwe 2 500 2 000 1 500 1 000 500 0 Z$ millions MOHCW Budget AIDS care 1992 1995 2000 2005 projections Source : HIV/AIDS in Zimbabwe, 1998 UNAIDS–Addis–May 1999
Impact of AIDS on employee benefits in South Africa percent of salary 20 Disability pension 18 16 Spouse’s pension 14 12 10 Lump sum at death 8 6 4 2 0 1995 2000 2005 projections Source: Southern African Economist, 1997 UNAIDS–Addis–May 1999
Change in per capita GDP* caused by AIDS, Kenya 6 200 6 000 5 800 5 600 5 400 5 200 5 000 4 800 K. Sh. No-AIDS scenario With-AIDS scenario 1985 1987 1989 1991 1993 1995 1997 1999 2001 2003 2005 projections * in 1985 Kenyan Shillings Source : AIDSCAP, 1996 UNAIDS–Addis–May 1999
Production in households with an AIDS death in Zimbabwe Reduction in output 61% 47% 49% 37% 29% Crops • Maize • Cotton • Vegetables • Groundnuts • Cattle owned Source: P. Kwaramba 1997
Impact of AIDS on Human Development Index (HDI) in South Africa 0.65 0.60 0.55 0.50 HDI without HIV with HIV 1995 2000 2005 2010 projections Source:HIV/AIDS & Human Development South Africa, UNAIDS & UNDP UNAIDS–Addis–May 1999
HIV prevalence in Nigerian military personnel according to years of duty as peacekeepers, 1998 - 1999 16 14 12 HIV prevalence (%) 10 8 6 4 2 0 1 2 3 Years of duty as peacekeepers Source: Adefolalu A. 3rd All African Congress of Armed Forces and Police Medical Services, 1999, Pretoria
Funeral expenses, commercial farm, Kenya Source: Rugalema et al. 1999
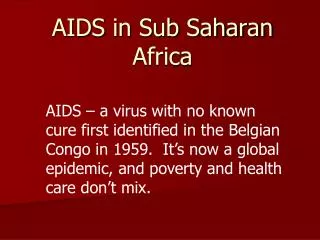
From Health Issue to Development Crisis • Destruction of social capital • Knowledge base of society • Production sectors: agriculture, industry • Weakening of institutions • Governance, civil service, judiciary, armed forces, education, health • Inhibition of private sector growth • Wider, deeper poverty
HIV/AIDS changes the welfare of countries In 1998 UNDP estimated that the Human Development Index (HDI) of South Africa would be 15% lower due to AIDS in 2010. Source: HIV/AIDS & Human Development South Africa, UNAIDS & UNDP, 2000
Impact at the Household Level Production & earnings Investment and consumption Household health and composition Psychic costs ¨ ¨ ¨ ¨ Reduced Medical costs Health maintaining Disutility to income activities reduced individual ¨ Funeral costs ¨ ¨ ¨ Reduced Loss of deceased Grief of ¨ productivity survivors Legal fees ¨ Poor health of ¨ ¨ Reallocation of survivors Dissavings labour & land ¨ ¨ Dissolution of Changes in household consumption & investment Source: Terminology - S. Kongsin, 2000
Household Impact of HIV/AIDS in Rwanda • In a four health facility survey: • Annual per capita use of outpatient health services was 11 visits per year for PLWHA compared with 0.3 visits in the general population • Annual per capita health expenditures in households were $63 for HIV/AIDS patients comped to $3 for households on average • Fewer than 30% of households were able to meet the costs of health care from their own resources Source: Schneider et al, 2000 paper presented at IAEN symposium, 2000
Orphans: A Lost Generation • Numbers are large and growing • Social support systems are overwhelmed • Risk of a lost generation: • little or no education • poor socialization • social upheaval • economic underclass
Household Impact: Caring for Orphans • A study from Uganda shows that 25% of households are providing for an orphan Source: Lyons, M. 1997 • A study from Tanzania shows that 21% of the families in Bukoba district were fostering an orphan Source: Rugalema, 1999
Impact on the Business sector • The impact on business depends on the benefit package offered by individual firms & include: • costs of treatment and funerals, • absenteeism, • replacement workers, • reduced productivity • re-training and • family pensions
Costs to Businesses • Costs of HIV to 5 firms in Botswana is estimated to rise 7 times between 1996 & 2004 to equal 5% of the wage bill Source: Greener, R. 1997 • Production loss as a result of AIDS was shown to be more than 3% of gross profit in 1995/96 on a Malawi tea estate Source: Jones, C. 1997
The cost of AIDS to business depends on labor intensity (% of profit) 16 percent 14 1994 12 2005 10 8 6 4 2 0 Textile Light Mfg & Svcs Wood processing Sugar Estate Transportation Average Source: AIDSCAP, 1996
Demand & Supply for Education Demand: • The school enrollment rate among orphans was 39% in Central African Republic, two thirds of the national rate of 60% Source: Survey from CAR, UNICEF, 1999 Supply: • 12% of all educators in South Africa were estimated to be HIV positive in 2000 Source: Coombe, C. 2000
Children who have lost a teacher to AIDS • More than 1% of the children in 19 countrieshave experienced a teacher who has died from AIDS • More than 2% of the children in Namibia have experienced a teacher who has died from AIDS • In Zambia and Zimbabwe, the percentage is more than 3% • In Botswana, with the highest HIV prevalence in Africa, 4% of the children have lost a teacher to AIDS. Source: UNICEF/UNAIDS, 2000
Notwithstanding the image of crisis, there have been some successes— Uganda Sénégal
Notwithstanding the image of crisis, there have been some successes— Uganda• public recognition of HIV/AIDS, public discussion
Notwithstanding the image of crisis, there have been some successes— Uganda• public recognition of HIV/AIDS, public discussion• HIV/AIDS as a family or community, rather than individual, issue
Notwithstanding the image of crisis, there have been some successes— Uganda• public recognition of HIV/AIDS, public discussion• HIV/AIDS as a family or community, rather than individual, issue Sénégal•registration of prostitutes >> free regular medical care >> reduction in STDs >> reduced transmission of HIV/AIDS
Notwithstanding the image of crisis, there have been some successes— Uganda• public recognition of HIV/AIDS, public discussion• HIV/AIDS as a family or community, rather than individual, issue Sénégal•registration of prostitutes >> free regular medical care >> reduction in STDs >> reduced transmission of HIV/AIDS For both Uganda and Sénégal•type and strain of HIV
Is there an AIDS crisis in Africa? A pandemic? Skepticism about measurement, data, assumptions•There is no AIDS•HIV does not cause AIDS
Is there an AIDS crisis in Africa? A pandemic? Skepticism about measurement, data, assumptions Critics:•There is no AIDS •HIV does not cause AIDS
How to decide which treatment(s) to use? Double-blind tests• On whom?•Under what circumstances? Ethics of medical testing•There is no AIDS •HIV does not cause AIDS
Policy Challenges1. Government role2. Access to medical care, both preventive and curative, including drugs