Download
1 / 17
170 likes | 321 Views
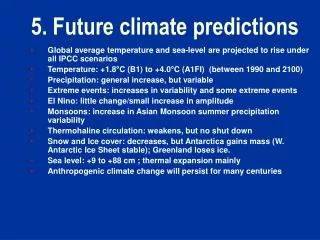
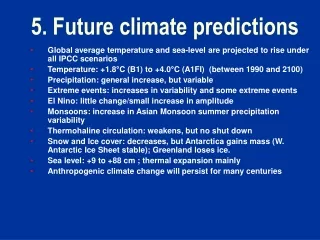
Measuring the performance of climate predictions Chris Ferro , Tom Fricker , David Stephenson Mathematics Research Institute University of Exeter, UK. IMA Conference on the Mathematics of the Climate System Reading, 14 September 2011. How good are climate predictions?.

E N D
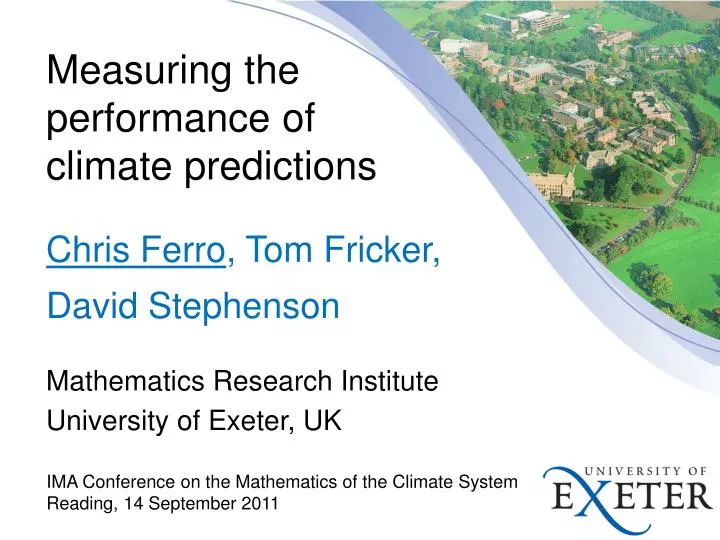
Measuring the performance of climate predictions Chris Ferro, Tom Fricker, David Stephenson Mathematics Research Institute University of Exeter, UK IMA Conference on the Mathematics of the Climate System Reading, 14 September 2011
How good are climate predictions? Predictions are useless without some information about their quality. • Focus on information contained in hindcasts, i.e. retrospective forecasts of past events. 1. How should we measure the performance of climate predictions? 2. What does past performance tell us about future performance?
Hindcasts Thanks: Doug Smith (Met Office Hadley Centre)
Challenges Sample sizes are small, e.g. CMIP5 core hindcast experiments give 10 predictions foreach lead time. Some external forcings (e.g. greenhouse gases and volcanoes) are prescribed, not predicted. • The quality of measurements of predictands varies over time and space. • Observations from the hindcast period are used (to some extent) to construct the prediction system.
Common practice Choice of predictand: Evaluate predictions only after removing biases Evaluate predictions of only long-term averages • Choice of performance measure: • Evaluate only the ensemble mean predictions Evaluate using correlation or mean square error Resample to estimate the sampling uncertainty
Common practice Choice of predictand: Evaluate predictions only after removing biases Evaluate predictions of only long-term averages • Choice of performance measure: • Evaluate only the ensemble mean predictions Evaluate using correlation or mean square error Resample to estimate the sampling uncertainty
Conventional reasoning We can’t predict weather at long lead times. So, don’t compare predicted and observed weather. Instead, compare predicted and observed climate, e.g. multi-year averages. Reduces noise and increases evaluation precision.
Evaluate weather, not climate! The foregoing argument is wrong for two reasons. We should evaluate predictands relevant to users. Evaluating climate averages reduces signal-to-noise ratios and so decreases evaluation precision. Better to evaluate predictions as weather forecasts and then average over time to improve precision.
Evaluate weather, not climate! Diprediction error for lead time i= 1, ..., n D error after averaging over the n lead times • S1mean of the square of the errors D1, ..., Dn Snsquare of the mean error D Under moderate conditions, the signal-to-noise ratio E(Sn)2 / var(Sn) of Sn becomes increasingly small relative to the signal-to-noise ratio of S1 as the averaging length, n, increases.
Common practice Choice of predictand: Evaluate predictions only after removing biases Evaluate predictions of only long-term averages • Choice of performance measure: • Evaluate only the ensemble mean predictions Evaluate using correlation or mean square error Resample to estimate the sampling uncertainty
Skill inflation Predictions initialized along trending observations.
Skill inflation Strong association even if predictions fail to follow observations over the lead time. Performance measures can mislead and mask differences between prediction systems.
Avoiding skill inflation Observations Xt and predictions Pt sampled over time t from a joint distribution function F. Real-valued performance measure, s(F). Suppose that the joint distribution, Ft, of (Xt, Pt) changes with t so that F is a mixture distribution. No skill inflation if s satisfies the following property: s(Ft) = s0 for all t implies s(F) = s0 for all mixtures F.
Avoiding skill inflation All convex properties of real-valued scoring rules, σ(X,P), are immune to skill inflation. These include • s(F) = expected value of σ(X,P), • e.g. mean square error, and • s(F) = any quantile of σ(X,P), • e.g. median absolute deviation. • Also monotonic functions of these, e.g. RMSE.
Summary Measuring performance can help to improve predictions and to guide responses to predictions. Evaluating climate predictions is hard because of small sample sizes, unpredicted forcings etc. Evaluate as weather forecasts then average! Use performance measures such as scoring rules that are immune to skill inflation from trends!
Related questions How does performance vary with the timescale of the predictand and of variations in the predictand? What can we learn by evaluating across a range of lead times and evaluation periods? What does past performance tell us about future performance? How should hindcast experiments be designed to yield as much information as possible?
References Ferro CAT, Fricker TE (2011) An unbiased decomposition of the Brier score. Submitted. Fricker TE, Ferro CAT (2011) A framework for evaluating climate predictions. In preparation. Goddard L and co-authors (2011) A verification framework for interannual-to-decadal prediction experiments. In preparation. Jolliffe IT, Stephenson DB (2011) Forecast Verification: A Practitioner’s Guide in Atmospheric Science. 2nd edition. Wiley. In press. Smith DM and co-authors (2007) Improved surface temperature prediction for the coming decade from a global climate model. Science, 317, 796—799. The EQUIP project: www.equip.leeds.ac.uk c.a.t.ferro@ex.ac.uk