Download
1 / 48
490 likes | 693 Views
Requirement Process. . Cont…. Cont…. Problem analysis often starts with a high-level "problem statement.“ During analysis the problem domain and the environment are modeled in an effort to understand the system behavior, constraints on the system, its inputs and outputs, etc. Cont….

E N D
Requirement Process . By Musa.D
Cont… By Musa.D
Cont… • Problem analysis often starts with a high-level "problem statement.“ • During analysis the problem domain and the environment are modeled in an effort to understand the system behavior, constraints on the system, its inputs and outputs, etc. By Musa.D
Cont… • What is the basic purpose of this activity? By Musa.D
Cont… • The basic aim of problem analysis is to obtain a clear understanding of the needs of the clients and the users, what exactly is desired from the software, and what the constraints on the solution are. By Musa.D
Cont.. • As the goal of analysis is to understand the problem domain, an analyst must be familiar with different methods of analysis and pick the approach that he feels is best suited to the problem at hand. What are these methods they? By Musa.D
1) Informal Approach • Like in any approach, the information about the system is obtained by interaction with the client, end users, questionnaires, study of existing documents, brainstorming, etc. By Musa.D
Cont… • Then what makes different form other approach? (e.g. formal approach)? By Musa.D
Cont… • Because it does use formal model to build the system. By Musa.D
Cont… • In informal approach model the analyst uses series meeting with users and clients • In the first meeting the clients and users explain to analyst about the their work, environment and their need as they perceived them. By Musa.D
Cont… • Once the analyst understands the system to some extent: • he uses the next few meetings to seek clarifications of the parts he does not understand. By Musa.D
Cont… In the final few meetings, the analyst essentially explains to the client: • what he understands the system should do( draft SRS). • uses the meetings as a means of verifying if what he proposes the system should do is indeed consistent with the objectives of the clients. By Musa.D
2) Data Flow Modeling • What do you know about Data Flow Modeling? By Musa.D
Cont… Defn: • As its name suggests, a data flow diagram graphically represents the flow of data. • DFDs aid in creating a structural representation of what happens to data as it is processed through some information system. • In simplest terms, the DFD tracks the data from an original source, carries it through a process, then flows it to a final destination. By Musa.D
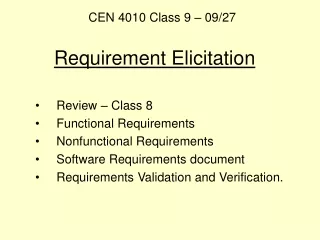
DFD’s Notations By Musa.D
Data flow diagram example. By Musa.D
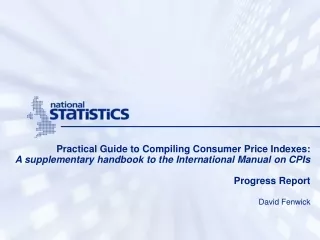
Abstract description of the system for handling payment. DFD of a system that pays workers. By Musa.D
Cont… • Mention the basic input (s) to the system? • Who is the originator of this input data? • Mention the basic output (s) to the system? • Who is the sink for this output? • Specify the inputs required to deduct tax? By Musa.D
Cont… • In this DFD there is one basic input data flow, the weekly timesheet, which originates from the source worker. • The basic output is the paycheck, the sink for which is also the worker. By Musa.D
Cont… • Can you guess why “*” is used in DFD above? By Musa.D
Cont… • The need for multiple data flows by a process is represented by a '*' between the data flows. • This symbol represents the AND relationship. By Musa.D
Cont… • Similarly, the OR relationship is represented by a ' + ' between the data flows. By Musa.D
Data Dictionary • Every DFD should accompanied with data dictionary. What will be its content? By Musa.D
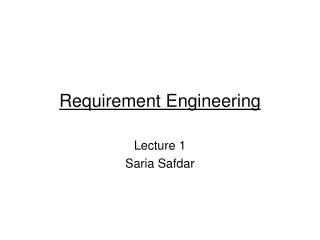
Cont… • The data dictionary is a repository of various data flows defined in a DFD. • The associated data dictionary states precisely the structure of each data flow in the DFD. By Musa.D
Cont… • To define the data structure, different notations are used. • '+‘ represent composition • '|‘ represent selection(OR) • '*‘ represent repetition By Musa.D
Data dictionary for the above DFD By Musa.D Data dictionary.
Structured Analysis Method • What is the main tools used by the system analyst in this method? By Musa.D
Cont… • The basic system view of this approach is that each system can be viewed as a transformation function operating within an environment that takes some inputs from the environment and produces some outputs for the environment By Musa.D
Cont… • DFDs are used heavily in Structured Analysis Method. • What will be done in this method to analysis the problem? By Musa.D
Cont… 1)Study the "physical environment.” and DFD of the current non automated (or partially automated) While drawing the DFD for the physical environment, an analyst has to interact with the users to determine the overall process from the point of view of the data. By Musa.D
Cont… • What is the purpose to analysis the current system? By Musa.D
Cont… • The basic purpose of analyzing the current system is to obtain a logical DFD for the system, where each data flow and each process is a logical entity or operation, rather than an actual name. By Musa.D
Cont… 2) The next step is to develop a logical model of the new system after the changes have been incorporated, and a DFD is drawn to show how data will flow in the new system. By Musa.D
Cont… • What is the difference between physical model and logical model? By Musa.D
Cont… • During logical model the analyst specifying only what needs to be done, not how it will be accomplished By Musa.D
example • A restaurant owner feels that some amount of automation will help make her business more efficient. She also believes that an automated system might be an added attraction for the customers. So she wants to automate the operation of her restaurant as much as possible By Musa.D
Cont… After many meetings and discussions with the restaurant owner, the following goals for the new system were established: • Automate much of the order processing and billing. • Automate accounting. By Musa.D
Cont… • Make supply ordering more accurate so that leftovers at the end of the day are minimized and the orders that cannot be satisfied due to non availability are also minimized. • The owner would also like to have statistics about sales of differentitems. By Musa.D
Cont… • perform the analysis for the above problem. • Who is the client? • Who are the customers? By Musa.D
Cont… • Draw context diagram of the restaurant. • Context diagram is DFD that treat a system as a single process. it identify the major inputs, outputs source of data and sink By Musa.D
Cont… Context diagram for the restaurant. By Musa.D
Cont… DFD for the existing restaurant system. By Musa.D
Cont… • See DFD for new system from new word file • restaurant • Prepare data dictionary new system DFD • DataDictionary By Musa.D
Cont… • What is the difference between flowchart and DFD? By Musa.D
Cont… • A DFD represents the flow of data, while a flowchart shows the flow of control. • A DFD does not represent procedural information whereas flowchart do. By Musa.D
Rules to follow while constructing DFD diagram • Start with a high-level data flow graph with few major transforms describing the entire transformation from the inputs to outputs and then refine each transform with more detailed transformations. By Musa.D
Cont… • Never try to show control logic. • Label each arrow with proper data elements. • Make use of * and + operations and show sufficient detail in the data flow graph. By Musa.D
lecture 6 Object oriented modeling.pptx By Musa.D