Download
1 / 33
340 likes | 477 Views
Modeling Motion. CPO Physics. Taken from a presentation original by Patsy Decoaster. Page 19. Monday 9/13. 19. 20. Modeling Motion. Practice. KISS, brief notes! Each slide less than 1 minute! Record less than 5 to 7 words per slide!. Write Study questions after class!.

E N D
Modeling Motion CPO Physics Taken from a presentation original by Patsy Decoaster
Page 19 Monday 9/13 19 20 Modeling Motion Practice KISS, brief notes! Each slide less than 1 minute! Record less than 5 to 7 words per slide! Write Study questions after class! Write Summary after class!
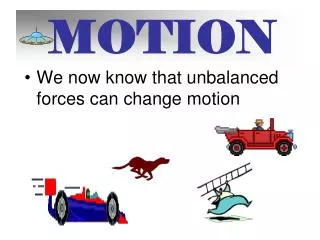
Relative Position QUESTION: How can you tell something has moved?
Distance from 1st Position Motion is always relative to a frame of reference.
Frames of Reference • The object or point from which movement is determined • Movement is relative to an object that appears stationary • Earth is the most common frame of reference
Questions • What is the frame of reference for the sunset? • What is a frame of reference? • What is the most common frame of reference?
Question • When can you determine how fast you are going in a jet plane?
Unit 1: Mechanics Chapter 2: Linear Motion • Motion is Relative • Speed and Velocity • Graphs of Motion
Key Question: What is speed and how is it measured? Speed
Speed Distance traveled (m) v = d t Speed (m/sec) Time taken (sec)
A bird is observed to fly 50 meters in 7.5 seconds. Calculate the speed of the bird in m/sec. Practice problem: Guess method on your slate! Calculate speed d= 50m t = 7.5s v = d÷t v = 50 m ÷ 7.5 s = 6.67 m/s
Calculate distance • How far do you go if you drive for 2 hours at a speed of 100 kilometers per hour? Practice problem: Guess method on your slate!
A space shuttle is traveling at a speed of 7,700 m/sec. How far does the shuttle travel in kilometers in one hour? Practice problem: Guess method on your slate! Calculate time
Calculating Speed • Why the letter v is used for speed... • We use the letter v to represent speed in a formula. • If this seems confusing, remember that v stands for velocity. • Speed is a single measurement that tells how fast you are going, like 100 km/h. • Velocity means you know both your speed and your direction.
Average speed • Total distance divided by the total time • Formula: • Total distance total time
Velocity • Speed in a given direction • Represented by a vector. • Velocities in the same direction combine by adding • Velocities in opposite directions combine by subtracting • Velocities added with vector geometry.
DisplacementDistance and Direction Displacement / time = Velocity.
To a scientist, a graph is a language that shows the relationship between two variables. By convention, graphs are drawn a certain way just like words are spelled certain ways. Graphical Data This graph shows the relationship between speed and distance.
Speed, the dependent variable goes on the y-axis. Distance is the independent variable and goes on the horizontal or x-axis. Graphical Data This graph shows the relationship between speed and distance.
Using graphical models If the graph is created from accurate data, the prediction will also be accurate.
Recognizing relationships in data • Cause and effect • Patterns indicate relationships Strong relationship between variables NO relationship between variables
Key Question: How do you model motion? Analyzing Motion with Graphs
How to make a graph • Decide what to put on the x and y axes. • Make a scale by counting boxes to fit your largest value (multiples of 1, 2, 5 or 10 are best). • Plot your points. • Draw a best fit curve. • Create a title and label each axis. Speed vs. Distance
The position versus time graph shows a boat traveling through a long canal. The boat has to stop at locks for changes in water level. a) How many stops does the boat make? b) What is the boat’s average speed for the whole trip? c) What is the highest speed the boat reaches? Interpret a position time graph
Slope • The slope of a line is the ratio of the “rise” (vertical change) to the “run”(horizontal change) of the line.
Constant Speed • On this graph, a constant speed is a straight horizontal line.