Download
1 / 6
60 likes | 271 Views
Figure 1. B. A. Figure 2. Figure 3. A. B. 1. CC. P = 0.003. CT/TT. .5. Insulin secretion. 0. -.5. 0. 5. 10. 15. Years from screening. Figure 4. B. A. C. D. Figure 5. B. A. C. D. P=. ATP-sensitive K + channel. MTNR1B. Figure 6. GLP-1. KCNJ11. KCNQ1. TCF7L2

E N D
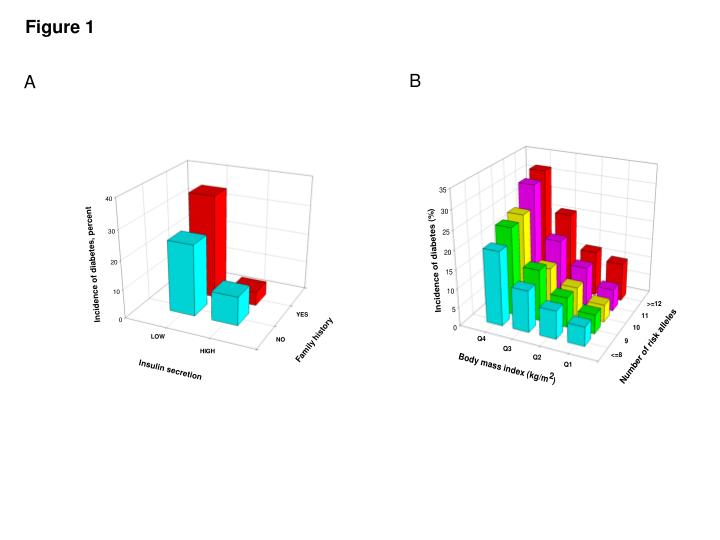
Figure 1 B A
Figure 3 A B 1 CC P = 0.003 CT/TT .5 Insulin secretion 0 -.5 0 5 10 15 Years from screening
Figure 4 B A C D
Figure 5 B A C D P=
ATP-sensitive K+ channel MTNR1B Figure 6 GLP-1 KCNJ11 KCNQ1 TCF7L2 WFS1 THADA KCNQ1 Glucose transporter (GLUT2) Α2-adrenergic receptor ß-cell proliferation Glucose cAMP CDKN2A/B,JAZF1,NOTCH,TCF1, THADA, HHEX, TCF7L2, WFS1, CDKAL1 Glucokinase GCK ADRA2A Glucose 6-phosphate WFS1 Glycolysis Endoplasmic reticulum Calcineurin Insulin- containing granules Ca2+ Insulin granule exocytosis TCF7L2 Mitochondrion SLC30A8 Nucleus Intracellular Ca+ stores IRS1 Voltage-gated Ca2+ channel Insulin receptor