Download
1 / 22
230 likes | 435 Views
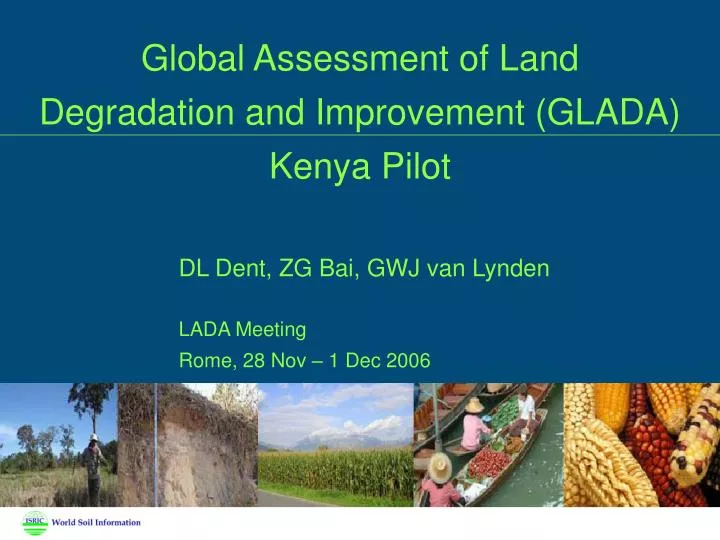
Global Assessment of Land Degradation and Improvement (GLADA) Kenya Pilot. DL Dent, ZG Bai, GWJ van Lynden LADA Meeting Rome, 28 Nov – 1 Dec 2006. GLADA. Land degradation is a global development issue No authoritative, global measure

E N D
Global Assessment of Land Degradation and Improvement (GLADA) Kenya Pilot DL Dent, ZG Bai, GWJ van Lynden LADA Meeting Rome, 28 Nov – 1 Dec 2006
GLADA • Land degradation is a global development issue • No authoritative, global measure • Needed: up-to-date, quantitative, reproducible assessment to support policy development for food and water security, economic development, environmental integrity
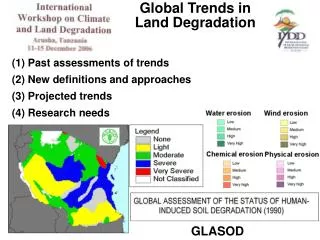
Output State and trends of land degradation Hot spots suffering extreme constraints or at severe risk Places where degradation has been arrested or reversed (Bright spots)
Rationale Biomass is an integrated measure of productivity; deviance from the norm is a measure of land degradation or improvement Biomass can be assessed by the normalized difference vegetation index (NDVI)
GLADA pilot Derive and map indicators of land degradation by analysis of the GIMMS NDVI data (8km-resolution, 25 years) Support with other global data (climate, SOTER, land cover, socio-economic) Illustrate with case study in Kenya, incorporating high-resolution land cover change data from Global Land Cover Network
Indicators • NDVI min, max, max-min, mean, sum, STD, CoV • - Rain-use efficiency • Deviations from the local norm • - ve = hot spots • +ve = bright spots • Trend • - ve = degradation • + ve = improvement
Data NDVI:NASA GIMMS : 8km resolution, fortnightly since 1981 Climate: CRU TS 2.1: ½ degree resolution, monthly climate VASClimO 1.1: ½ degree resolution, monthly precipitation, GPCC/DWD NPP:MODIS 8-day NPP, 2000-2003 Land cover: Landsat: 30m resolution 1976, 1990, 2000; GLC2000 FAO Africover data - Kenya Soil and terrain:SOTER scale 1:1M incorporating 90m-resolution SRTM digital elevation model Socio-economic: CEEPA
Operation NASA/GIMMS NDVI images Geo-reference NDVI images Derive NDVI indicators: min, max, max-min, mean, sum, STD, CoV Rain-use efficiency Rainfall = + Patterns and trends in NDVI indicators Patterns and trends in rain-use efficiency Hot spots ? Map of biomass trend Map combined biomass + RUE trend NPP loss GLADA database Stratifying by land use climate, SOTER, CEEPA
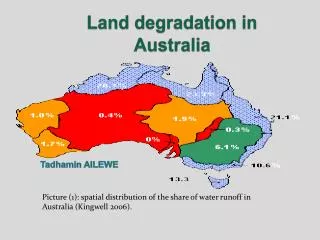
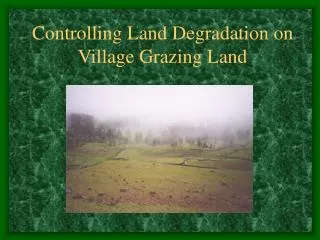
Kenya pilot • 80 per cent dryland- Declining GDP- Population doubles every 15 years- Rapid land use change- Land degradation
NDVI trend – Hot spots ? Over the period, biomass increased over most of the land area but decreased over 1/5 Decrease correlated with the cropped area
Reduction in biomass does not necessarily mean land degradation Biomass fluctuates with rainfall, stage of growth, changes in land use
Rainfall trend Rainfall increased across 80% of the area, with a large increase in the cropland in Eastern Province
Rain-use efficiency Declining rain-use efficiency: - Drylands around Lake Turkana - Cropland in Eastern Province
Improved Degraded Stable
Guardian Weekly June 16-22 2006 Hot spots:negative NDVI and negative RUE
For Kenya: Biomass increased overall 1981-2003 Little increase in productivity of cropland, production decreased over 40% of the area Hot spots indicated by declining NPP and declining RUE 18% of area: - Turkana drylands - Extension of arable into marginal lands
And finally Interpretation not straightforward - various NDVI patterns must be analysed, rain-use efficiency a more robust indicator, NPP is an economic indictor Confirmation requires field work! GLADA distinguishes between current degradation and historical legacy Geo-located indices of land degradation enable statistical exploration of social, economic and biophysical drivers of degradation GLADA can be input to an early warning system
Acknowledgements CJ Tucker, JE Pinzon and ME Brown for access to the GIMMSM Salmon for the CRU TS 2.1, J Grieser for the VASClimO 1.1 ME Schaepman for concept developmentP Tempel, J Hunting, VWP van Engelen, JH Kauffman, AE Hartemink, S Mantel ISRIC colleagues This work was commissioned by FAO