Download
1 / 38
380 likes | 532 Views
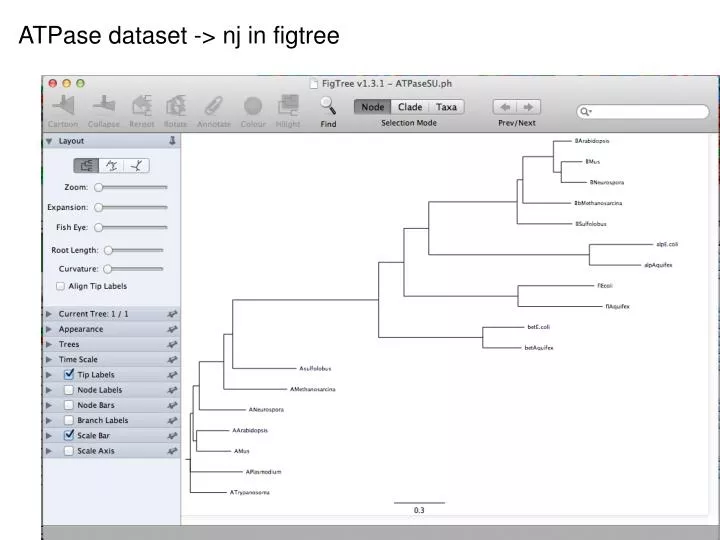
ATPase dataset -> nj in figtree. ATPase dataset -> nj in figtree. ATPase dataset -> nj in figtree. ATPase dataset -> nj in figtree. ATPase dataset -> nj in figtree. ATPase dataset -> nj in figtree. ATPase dataset -> nj in figtree. ATPase dataset -> muscle -> phyml (with ASRV)– re-rooted .

E N D
ATPase dataset -> muscle -> parsimony – re-rooted gaps as missing data
ATPase dataset -> muscle -> parsimony – re-rooted gaps as missing data
Why could a gene tree be different from the species tree? • Lack of resolution • Lineage sorting • Gene duplications/gene loss (paralogs/orthologs) • Gene transfer • Systematic artifacts (e.g., compositional bias and long branch attraction)
Trees – what might they mean? Calculating a tree is comparatively easy, figuring out what it might mean is much more difficult. If this is the probable organismal tree: species A species B species C species D what could be the reason for obtaining this gene tree: seq. from A seq. from D seq. from C seq. from B
e.g., 60% bootstrap support for bipartition (AD)(CB) lack of resolution seq. from A seq. from D seq. from C seq. from B
the two longest branches join together e.g., 100% bootstrap support for bipartition (AD)(CB) long branch attraction artifact seq. from A seq. from D seq. from C seq. from B What could you do to investigate if this is a possible explanation? use only slow positions, use an algorithm that better corrects for ASRV
Gene Transfer molecular tree: seq. from A seq. from D seq. from C seq. from B speciation genetransfer Gene transfer Organismal tree: species A species B species C species D
molecular tree: seq. from A seq. from D seq. from C seq. from B Lineage Sorting Organismal tree: species A species B species C Genes diverge and coexist in the organismal lineage species D
molecular tree: molecular tree: seq. from A seq. from A seq. from A seq. from B seq. from B seq. from C seq. from C seq. from D seq. from D seq. from D seq.’ from B seq.’ from B seq.’ from C seq.’ from C seq.’ from C gene duplication gene duplication gene duplication seq.’ from D seq.’ from D seq.’ from D Gene duplication Organismal tree: species A species B species C gene duplication species D molecular tree:
Gene duplication and gene transfer are equivalent explanations. The more relatives of C are found that do not have the blue type of gene, the less likely is the duplication loss scenario Ancient duplication followed by gene loss Horizontal or lateral Gene Note that scenario B involves many more individual events than A 1 HGT with orthologous replacement 1 gene duplication followed by 4 independent gene loss events
Function, ortho- and paralogy molecular tree: seq. from A seq.’ from B seq.’fromC seq.’ from D gene duplication seq. from B seq. from C seq. from D The presence of the duplication is a taxonomic character (shared derived character in species B C D). The phylogeny suggests that seq’ and seq have similar function, and that this function was important in the evolution of the clade BCD. seq’ in B and seq’in C and D are orthologs and probably have the same function, whereas seq and seq’ in BCD probably have different function (the difference might be in subfunctionalization of functions that seq had in A. – e.g. organ specific expression)
Y chromosome Adam Mitochondrial Eve Lived approximately 40,000 years ago Lived 166,000-249,000 years ago Thomson, R. et al. (2000) Proc Natl Acad Sci U S A 97, 7360-5 Underhill, P.A. et al. (2000) Nat Genet 26, 358-61 Mendez et al. (2013) American Journal of Human Genetics 92 (3): 454. Cann, R.L. et al. (1987) Nature 325, 31-6 Vigilant, L. et al. (1991) Science 253, 1503-7 Albrecht Dürer, The Fall of Man, 1504 Adam and Eve never met The same is true for ancestral rRNAs, EF, ATPases!
From: http://www.nytimes.com/2012/01/31/science/gains-in-dna-are-speeding-research-into-human-origins.html?_r=1
The multiregional hypothesis From http://en.wikipedia.org/wiki/Multiregional_Evolution
Did the Denisovans Cross Wallace's Line? Science 18 October 2013: vol. 342 no. 6156 321-323 Ancient migrations. The proportions of Denisovan DNA in modern human populations are shown as red in pie charts, relative to New Guinea and Australian Aborigines (3). Wallace's Line (8) is formed by the powerful Indonesian flow-through current (blue arrows) and marks the limit of the Sunda shelf and Eurasian placental mammals.
Archaic human admixture with modern Homo sapiens From: http://en.wikipedia.org/wiki/Archaic_human_admixture_with_modern_Homo_sapiens
For more discussion on archaic and early humans see: http://en.wikipedia.org/wiki/Denisova_hominin http://www.nytimes.com/2012/01/31/science/gains-in-dna-are-speeding-research-into-human-origins.html http://www.sciencedirect.com/science/article/pii/S0002929711003958 http://www.abc.net.au/science/articles/2012/08/31/3580500.htm http://www.sciencemag.org/content/334/6052/94.full http://www.sciencemag.org/content/334/6052/94/F2.expansion.html http://haplogroup-a.com/Ancient-Root-AJHG2013.pdf
written and distributed by Joe Felsenstein and collaborators (some of the following is copied from the PHYLIP homepage) Phylip PHYLIP (the PHYLogeny Inference Package) is a package of programs for inferring phylogenies (evolutionary trees). PHYLIP is the most widely-distributed phylogeny package, and competes with PAUP* to be the one responsible for the largest number of published trees. PHYLIP has been in distribution since 1980, and has over 15,000 registered users. Output is written onto special files with names like "outfile" and "outtree". Trees written onto "outtree" are in the Newick format, an informal standard agreed to in 1986 by authors of a number of major phylogeny packages. Input is either provided via a file called “infile” or in response to a prompt.
What’s in PHYLIP Programs in PHYLIP allow to do parsimony, distance matrix, and likelihood methods, including bootstrapping and consensus trees. Data types that can be handled include molecular sequences, gene frequencies, restriction sites and fragments, distance matrices, and discrete characters. Phylip works well with protein and nucleotide sequences Many other programs mimic the style of PHYLIP programs. (e.g. TREEPUZZLE, phyml, protml) Many other packages use PHYIP programs in their inner workings (e.g., PHYLO_WIN) PHYLIP runs under all operating systems Web interfaces are available
Programs in PHYLIP are Modular For example: SEQBOOT take one set of aligned sequences and writes out a file containing bootstrap samples. PROTDIST takes a aligned sequences (one or many sets) and calculates distance matices (one or many) FITCH (or NEIGHBOR) calculate best fitting or neighbor joining trees from one or many distance matrices CONSENSE takes many trees and returns a consensus tree …. modules are available to draw trees as well, but often people use treeview or njplot
The Phylip Manual is an excellent source of information. Brief one line descriptions of the programs are here The easiest way to run PHYLIP programs is via a command line menu (similar to clustalw). The program is invoked through clicking on an icon, or by typing the program name at the command line. > seqboot > protpars > fitch If there is no file called infile the program responds with: [gogarten@carrot gogarten]$ seqboot seqboot: can't find input file "infile" Please enter a new file name>
menu interface example: seqboot and protpars on infile1
Sequence alignment: CLUSTALW MUSCLE Removing ambiguous positions: T-COFFEE FORBACK Generation of pseudosamples: SEQBOOT PROTDIST TREE-PUZZLE Calculating and evaluating phylogenies: PROTPARS PHYML NEIGHBOR FITCH SH-TEST in TREE-PUZZLE CONSENSE Comparing phylogenies: Comparing models: Maximum Likelihood Ratio Test Visualizing trees: ATV, njplot, or treeview Phylip programs can be combined in many different ways with one another and with programs that use the same file formats.