Download
1 / 6
60 likes | 63 Views
DNA Microarray Data Analysis using Artificial Neural Network Models. by Venkatanand Venkatachalapathy (‘Venkat’) ECE/ CS/ ME 539 Course Project. Genes {DNA} RNA intermediate Protein GENE EXPRESSION

E N D
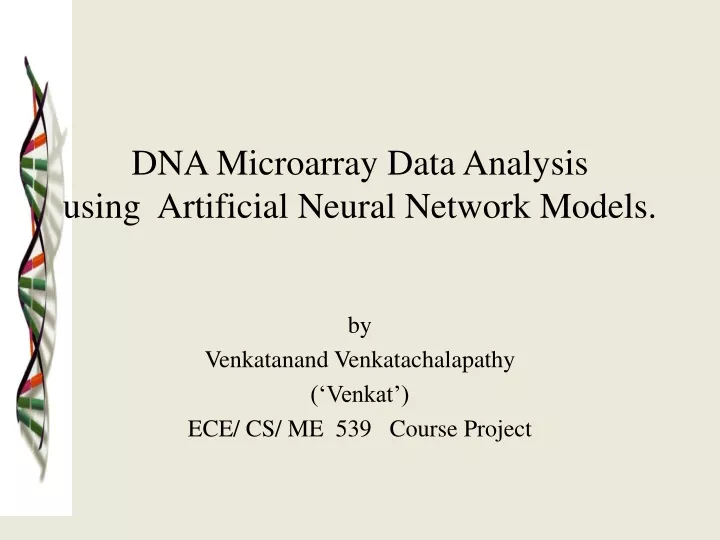
DNA Microarray Data Analysisusing Artificial Neural Network Models. by Venkatanand Venkatachalapathy (‘Venkat’) ECE/ CS/ ME 539 Course Project
Genes {DNA} RNA intermediate Protein GENE EXPRESSION (Gene expression refers to both transcription and translation.) Genes (information molecules) – code for RNA & Proteins (functional molecules- properties of cell). “Gene Expression Level” - amount of Prot./ RNA produced per gene. Expression varies dynamically with time depending on environment, stage of development of cell etc. When expression level is “high” or “low” with respect to a reference condition (‘normal state’) , GENE is said to be switched ‘ON’ or ‘OFF’. Genetic information flow Transcription Translation
Microarray experiments and data • Measures Gene Exp. level of 1000’s of genes in a single experiment. • For a single experiment, each gene has a data point expressed as a ratio of current state expression to reference state expression. Eg. Exp. level for Genes [A B C] = [ 3000/10 10/30 1/1] (Conventionally, these ratios are normalized on a log scale) • ‘N’ such experiments for M genes give rise to GENE EXPRESSION MATRIX ( M x N) G(i,j) = expression level of ith gene in jth experiment. (Collection of Gene expression row vectors) • Enormous Significance in Biotech. & Medicine! WHY? Genome projects completed, => KNOW GENETIC CODE , MUST FIND FUNCTION?
Project Problem & Methodology OBJECTIVE: • Classify “unknown” genes to functional classes based on: - Microarray gene expression data & Knowledge about function of “well known” genes. • A Graphical User Interface for the analysis. SOLUTION STRATEGY: • Functionally related genes have similar expression level! Two step: • For “Well known genes” - correlate their gene expression vector & functional class. This correlation can be encoded in a Neural Network! • Using this Neural Network, classify of unknown genes using its gene expression vector!
ANN Models & Program Features • Models chosen MLP (used bp.m) , SVM (linear kernel, polynomial kernel, radial basis kernel – svmdemo.m) • GUI Interface accepting comma limited gene expression data files (.csv).
Data Source: Stanford Microarray Database. Classification of 2467 genes into “TCA” Class and “Non-TCA” Class (Tested by 3- way cross validation) Brown et al used SVM Radial Basis : 99.5% MLP Results SVM results Preliminary Results